
Performance Ratio
The Performance Ratio page computes the PR of a plant over a user-defined date range, comparing the actual production with the theoretical producible energy derived from the measured irradiation, the plant nominal power and the module/ambient temperatures.
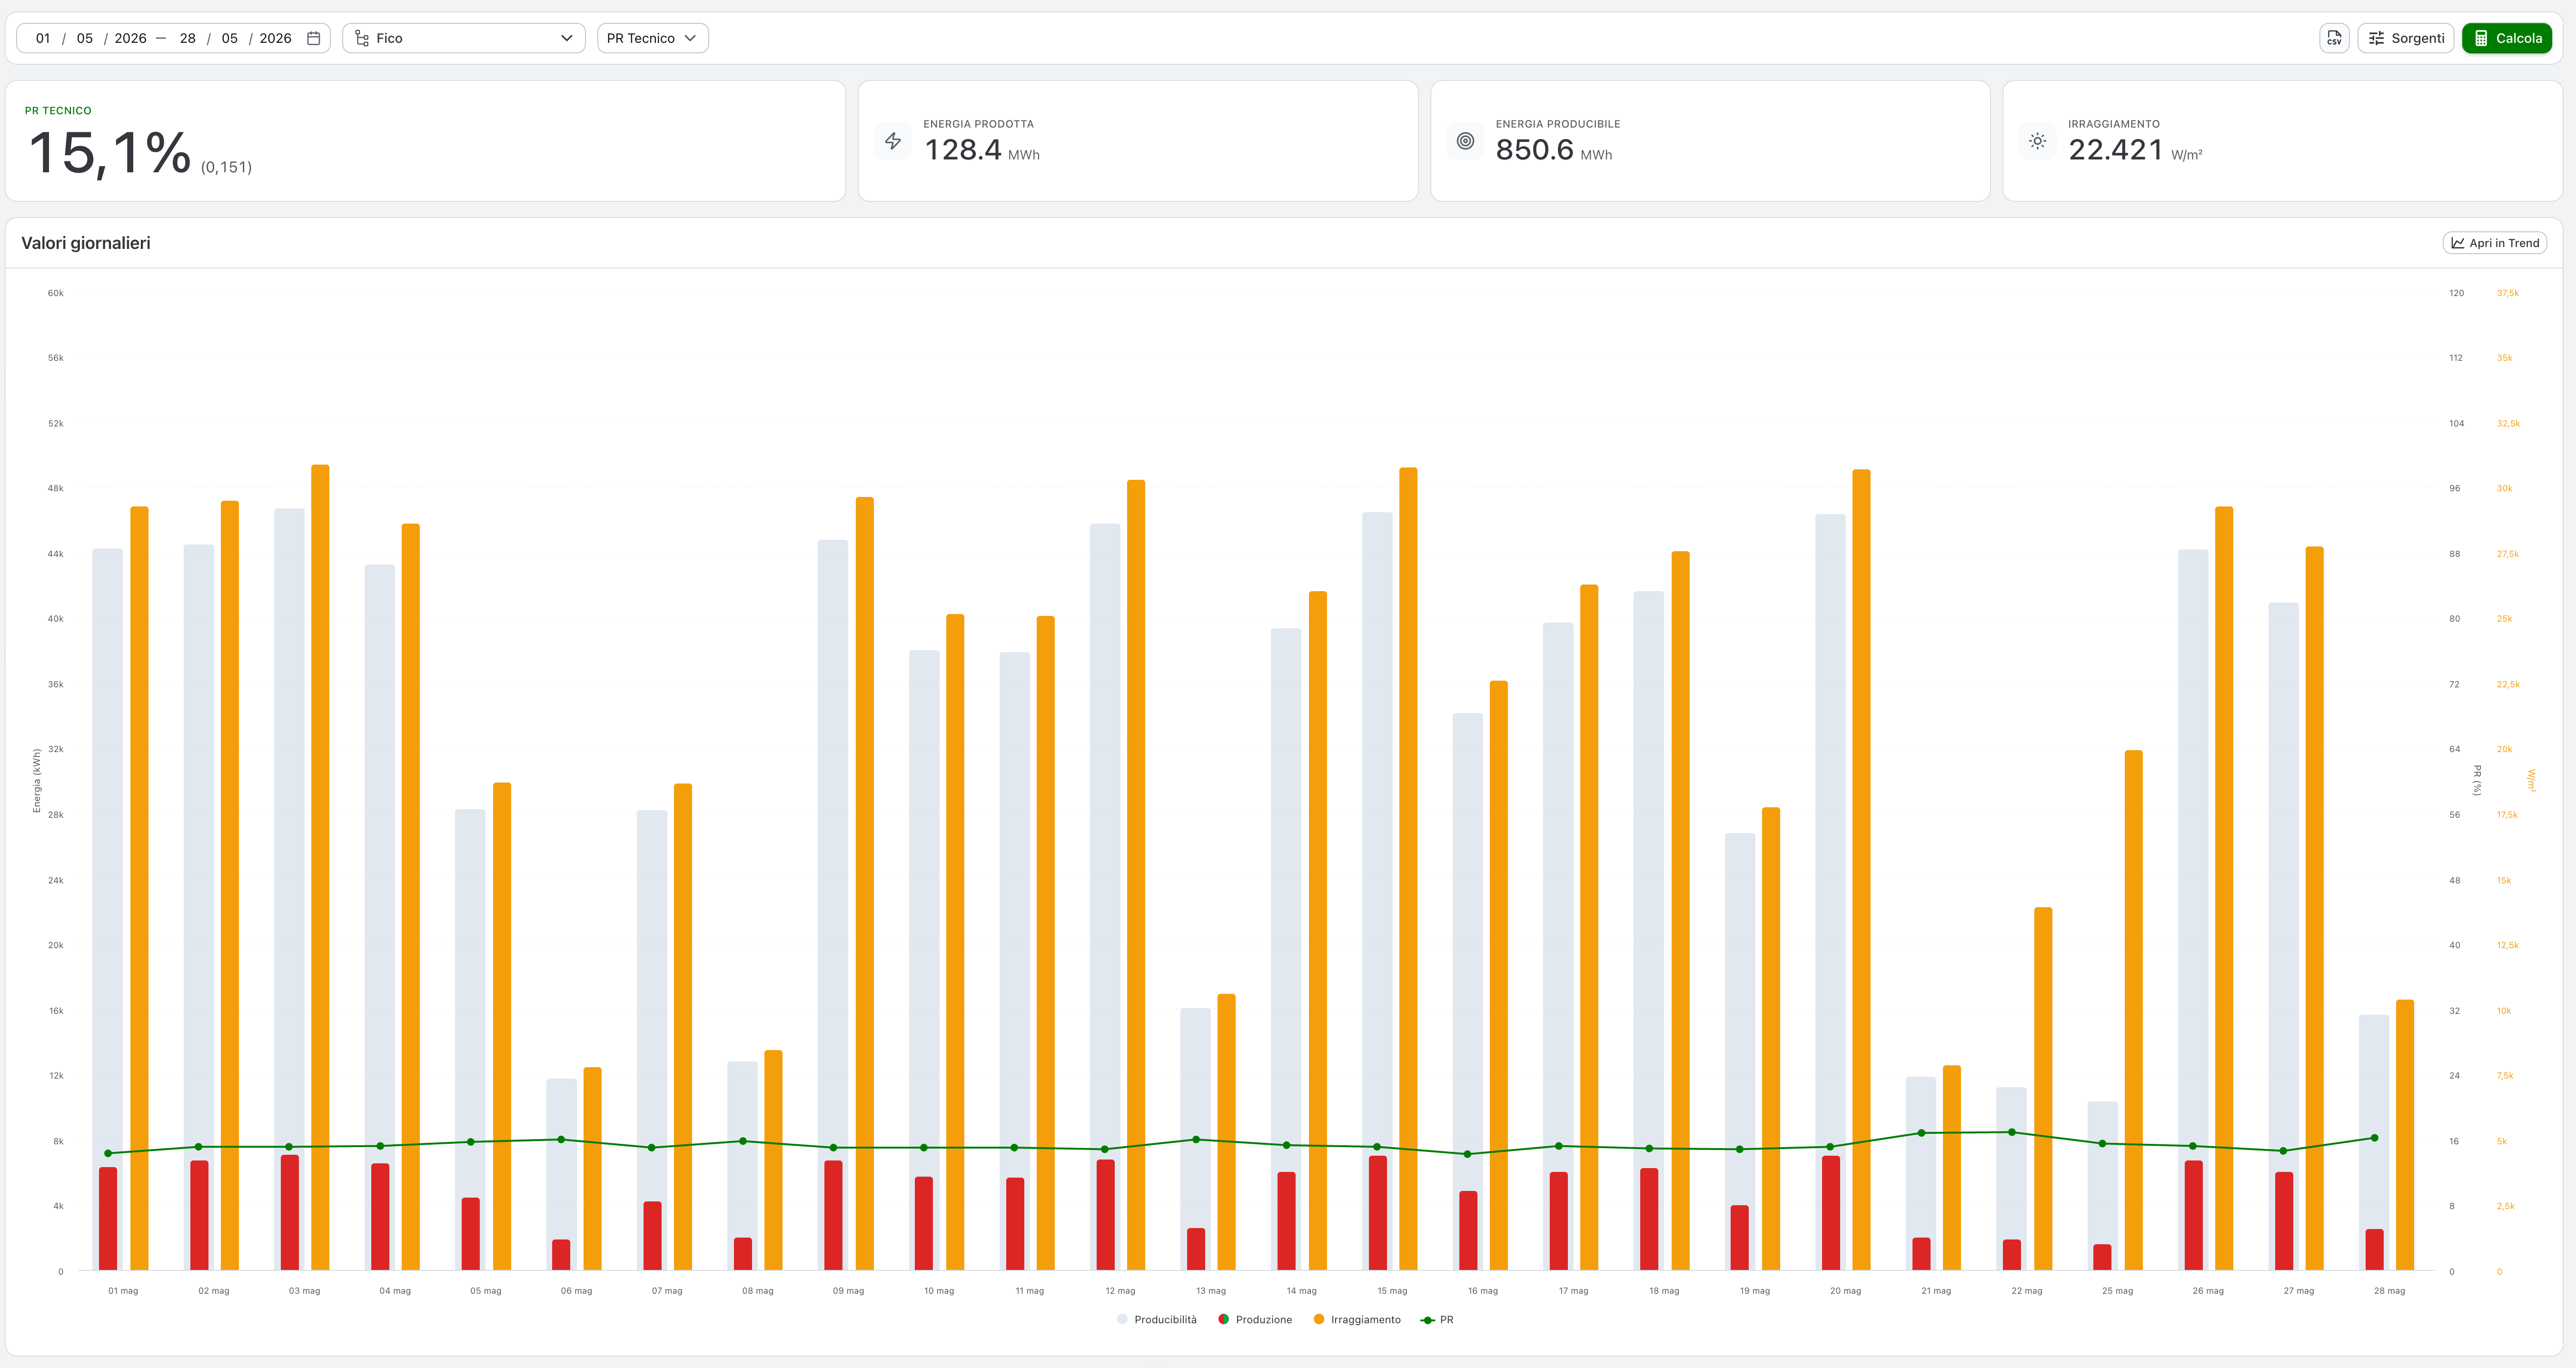
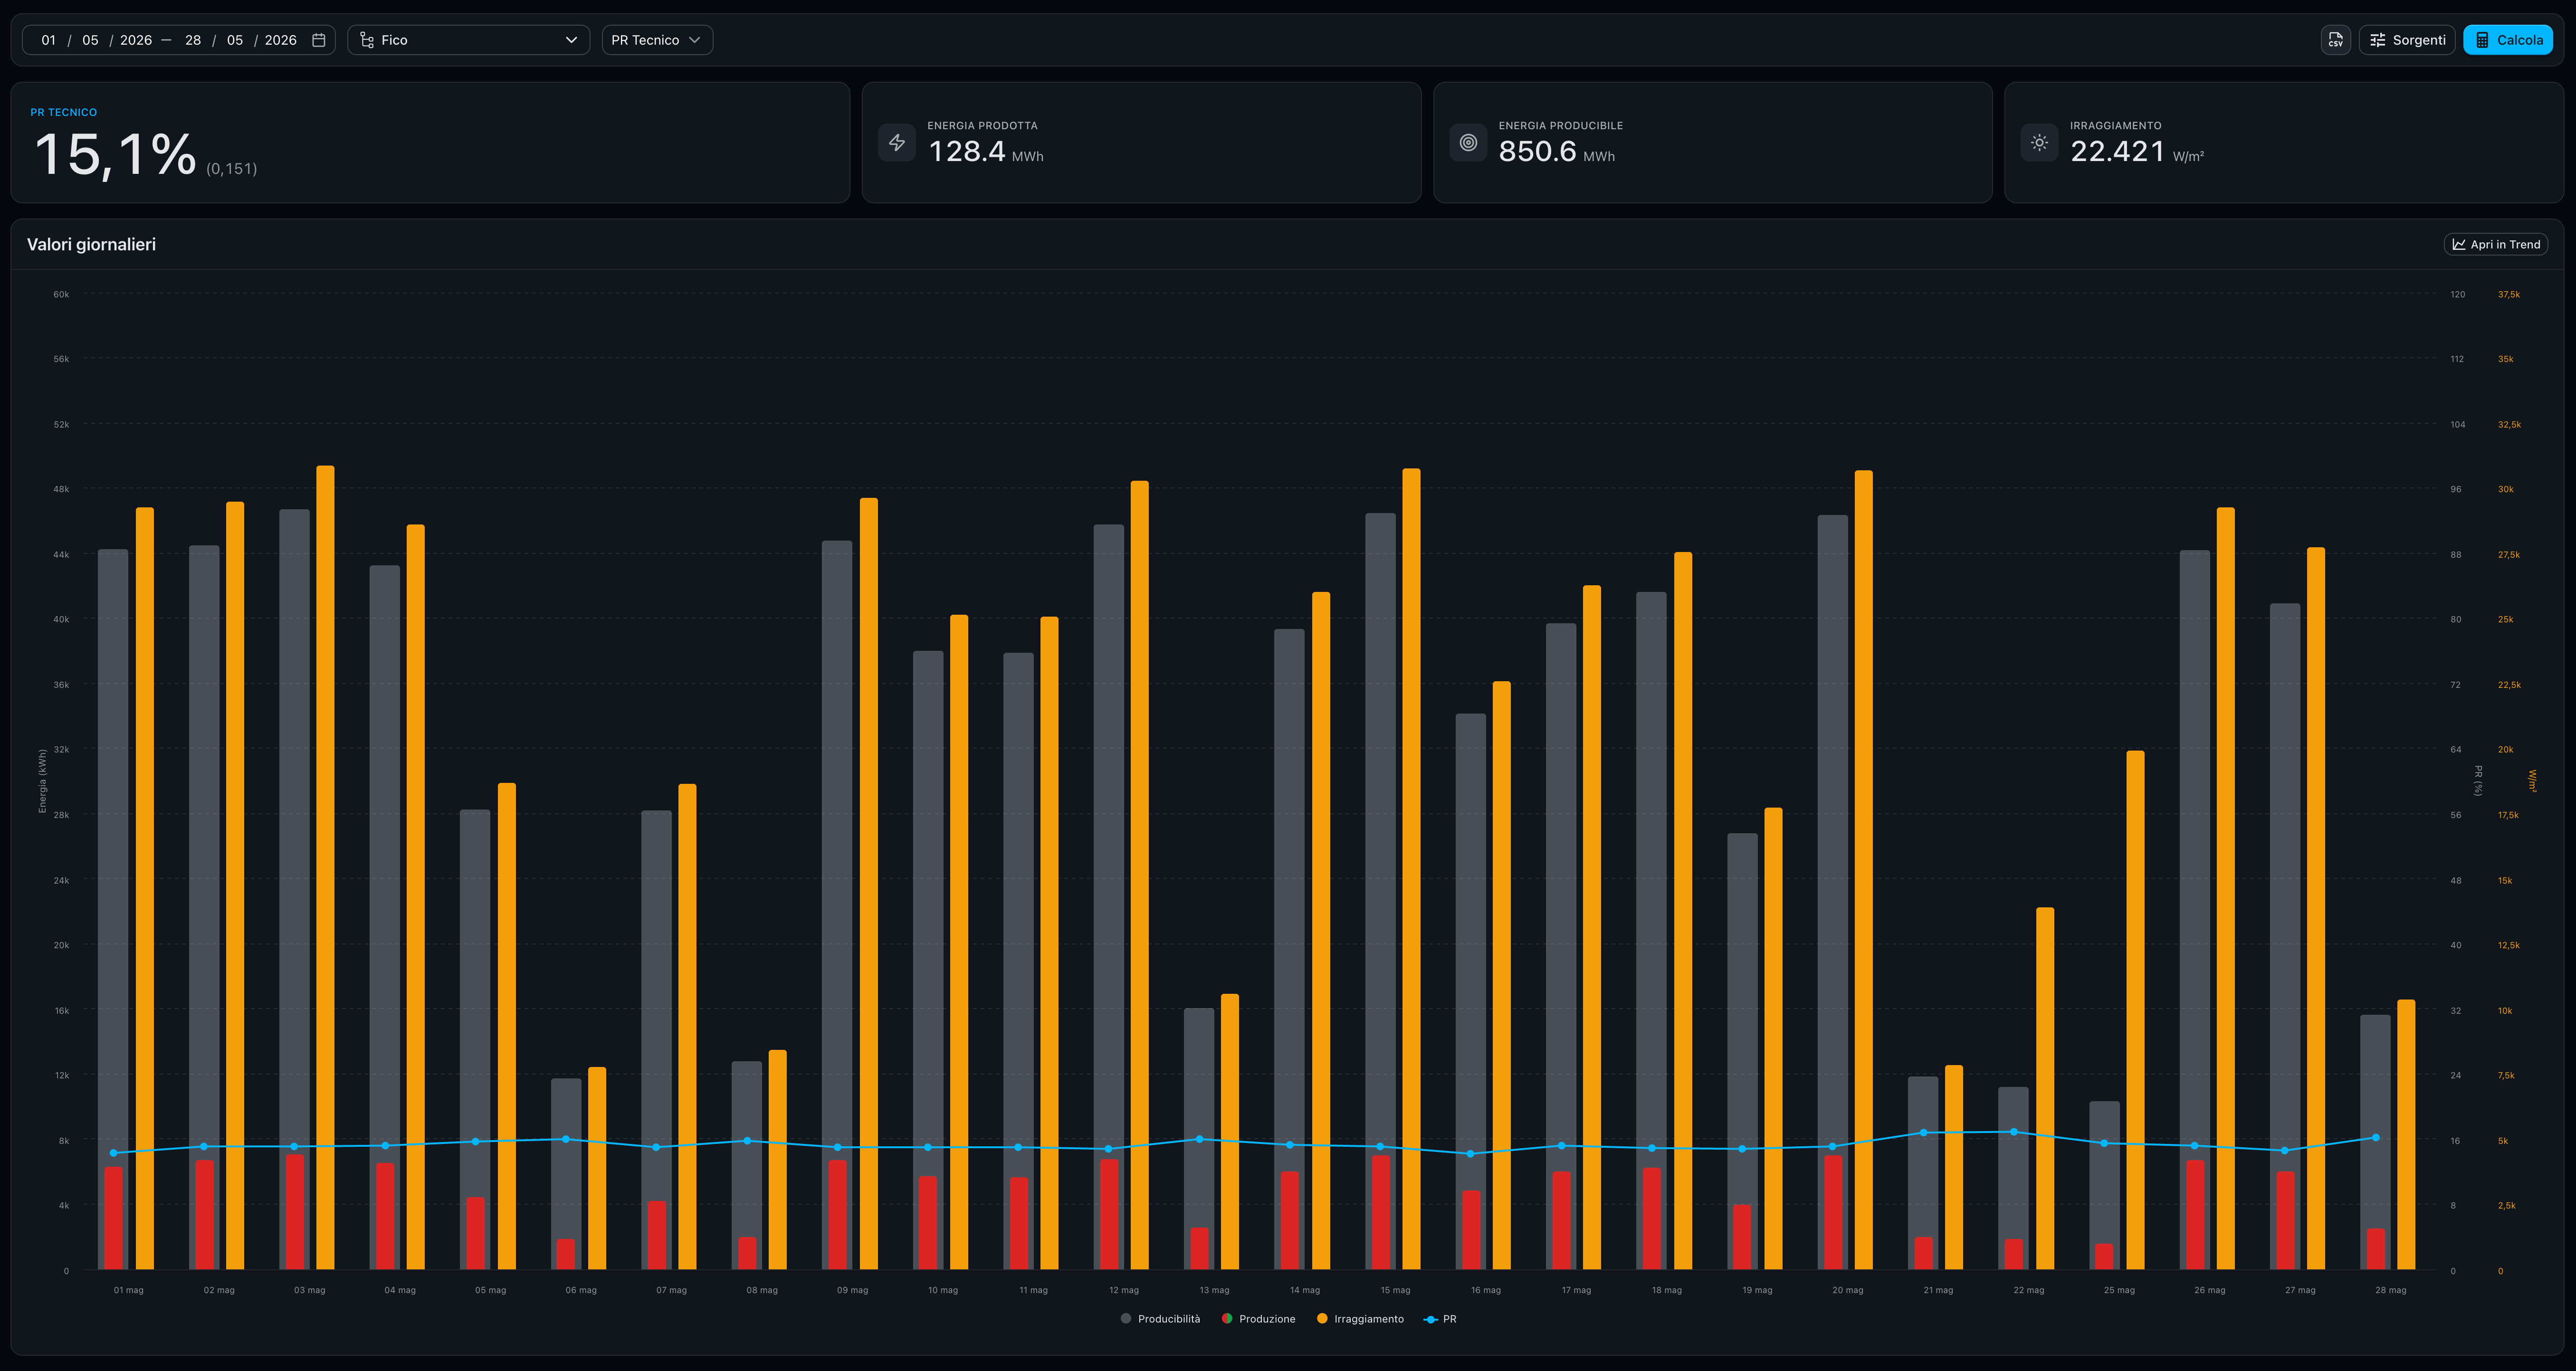
Two calculation modes are available:
- PR Technical (default) — at each instant the theoretical producible power uses only the nominal power of the inverters that are actually operating. Inverters that are not available in a given period (not ready, stopped, in fault) are excluded from the theoretical producible, so the PR is not penalised by inverter downtime.
- PR Raw — the theoretical producible power always uses the full plant nominal power, regardless of the inverters' operating state.
Sensor sources (production, irradiation, module temperature, ambient temperature) can be customised through the Sources drawer: the calculation is redone with the chosen signals and a dedicated badge highlights that the current result uses custom sources.
A monthly PR target can be configured per plant to correct the producible energy — see PR targets.
Toolbar


On the left:
- Date range — date picker with time; the range is propagated to the calculation and to the Trend deep-link.
- Plant — single-selection plants tree.
- PR type — select between Technical and Raw.
- Custom badge — appears when at least one source has been replaced via the drawer.
On the right:
- PR targets — opens the PR targets page to configure the monthly targets.
- Export CSV — exports the computed daily data of the period.
- Sources — opens a drawer where you can choose custom signals for production, irradiation, module temperature and ambient temperature. You can also save a snapshot of the sources to re-apply later.
- Calculate — runs the calculation. When the displayed data no longer matches the current configuration, an amber dot appears on the button (stale).
KPI strip
After running the calculation, an aggregated KPI strip appears at the top of the results area.


| KPI | Meaning |
|---|---|
| Performance Ratio | Average PR over the period (produced energy / producible energy). |
| Produced energy | Energy actually produced by the plant. |
| Producible energy | Theoretical energy producible given the measured irradiation and the plant nominal power. When a monthly PR target is configured, a × target badge on this card shows that the producible energy has been corrected by the target. |
| Average irradiation | Mean irradiation over the period. |
When data is stale (the configuration changed but Calculate has not been re-run), the strip is rendered with reduced opacity as a reminder to re-run Calculate.
Daily chart
The chart plots, for each day of the period, the producible energy, the produced energy and the daily PR line.
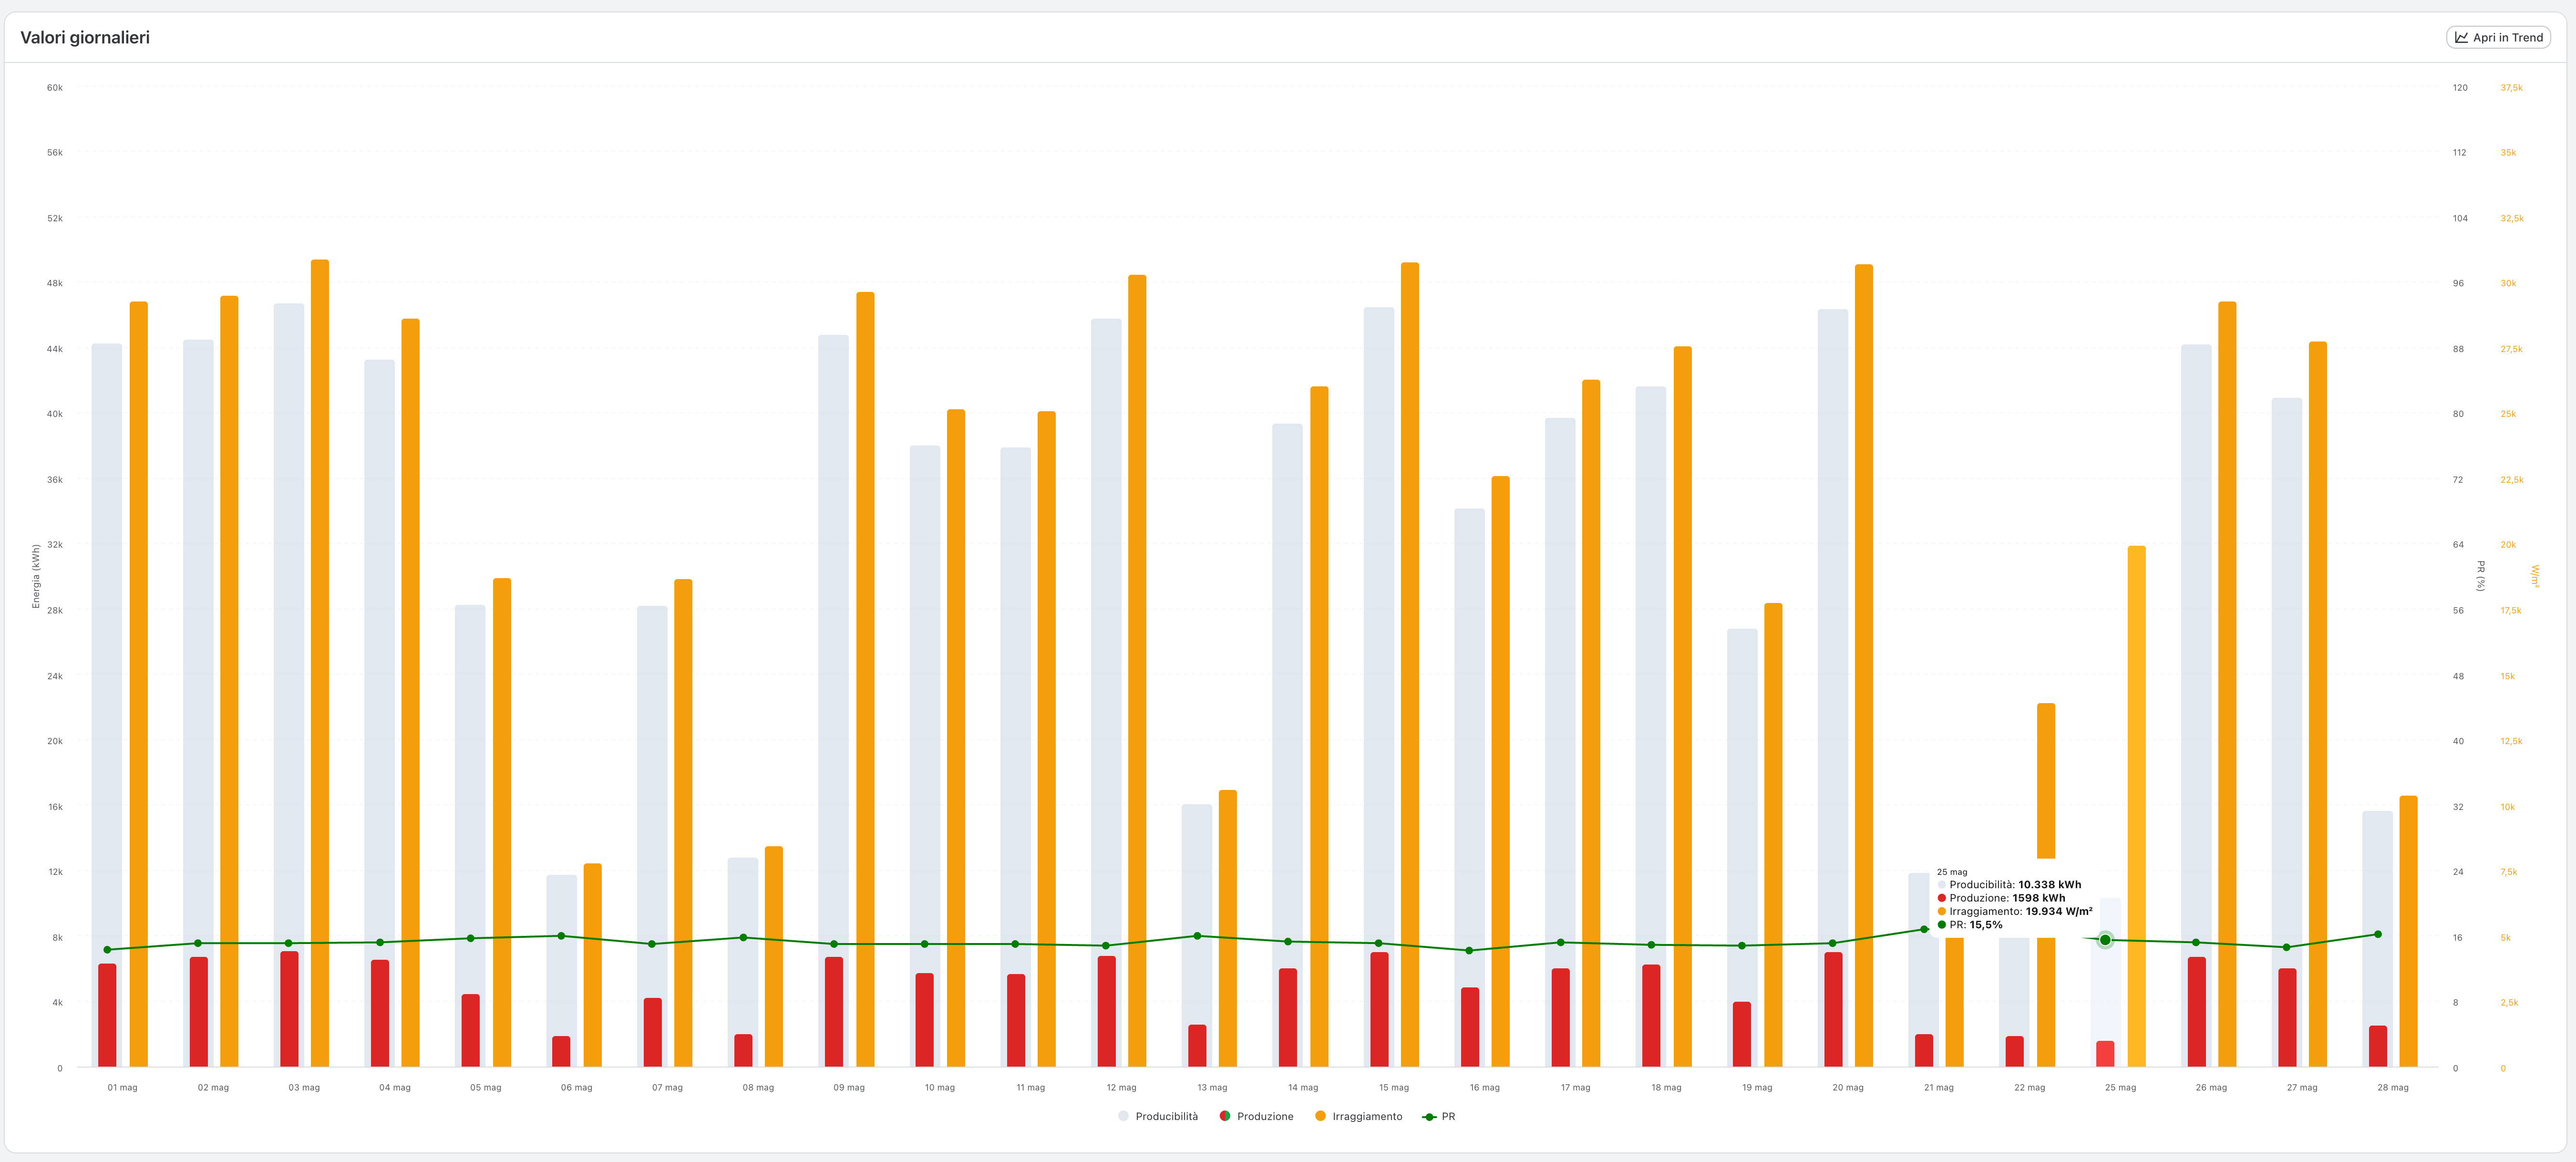
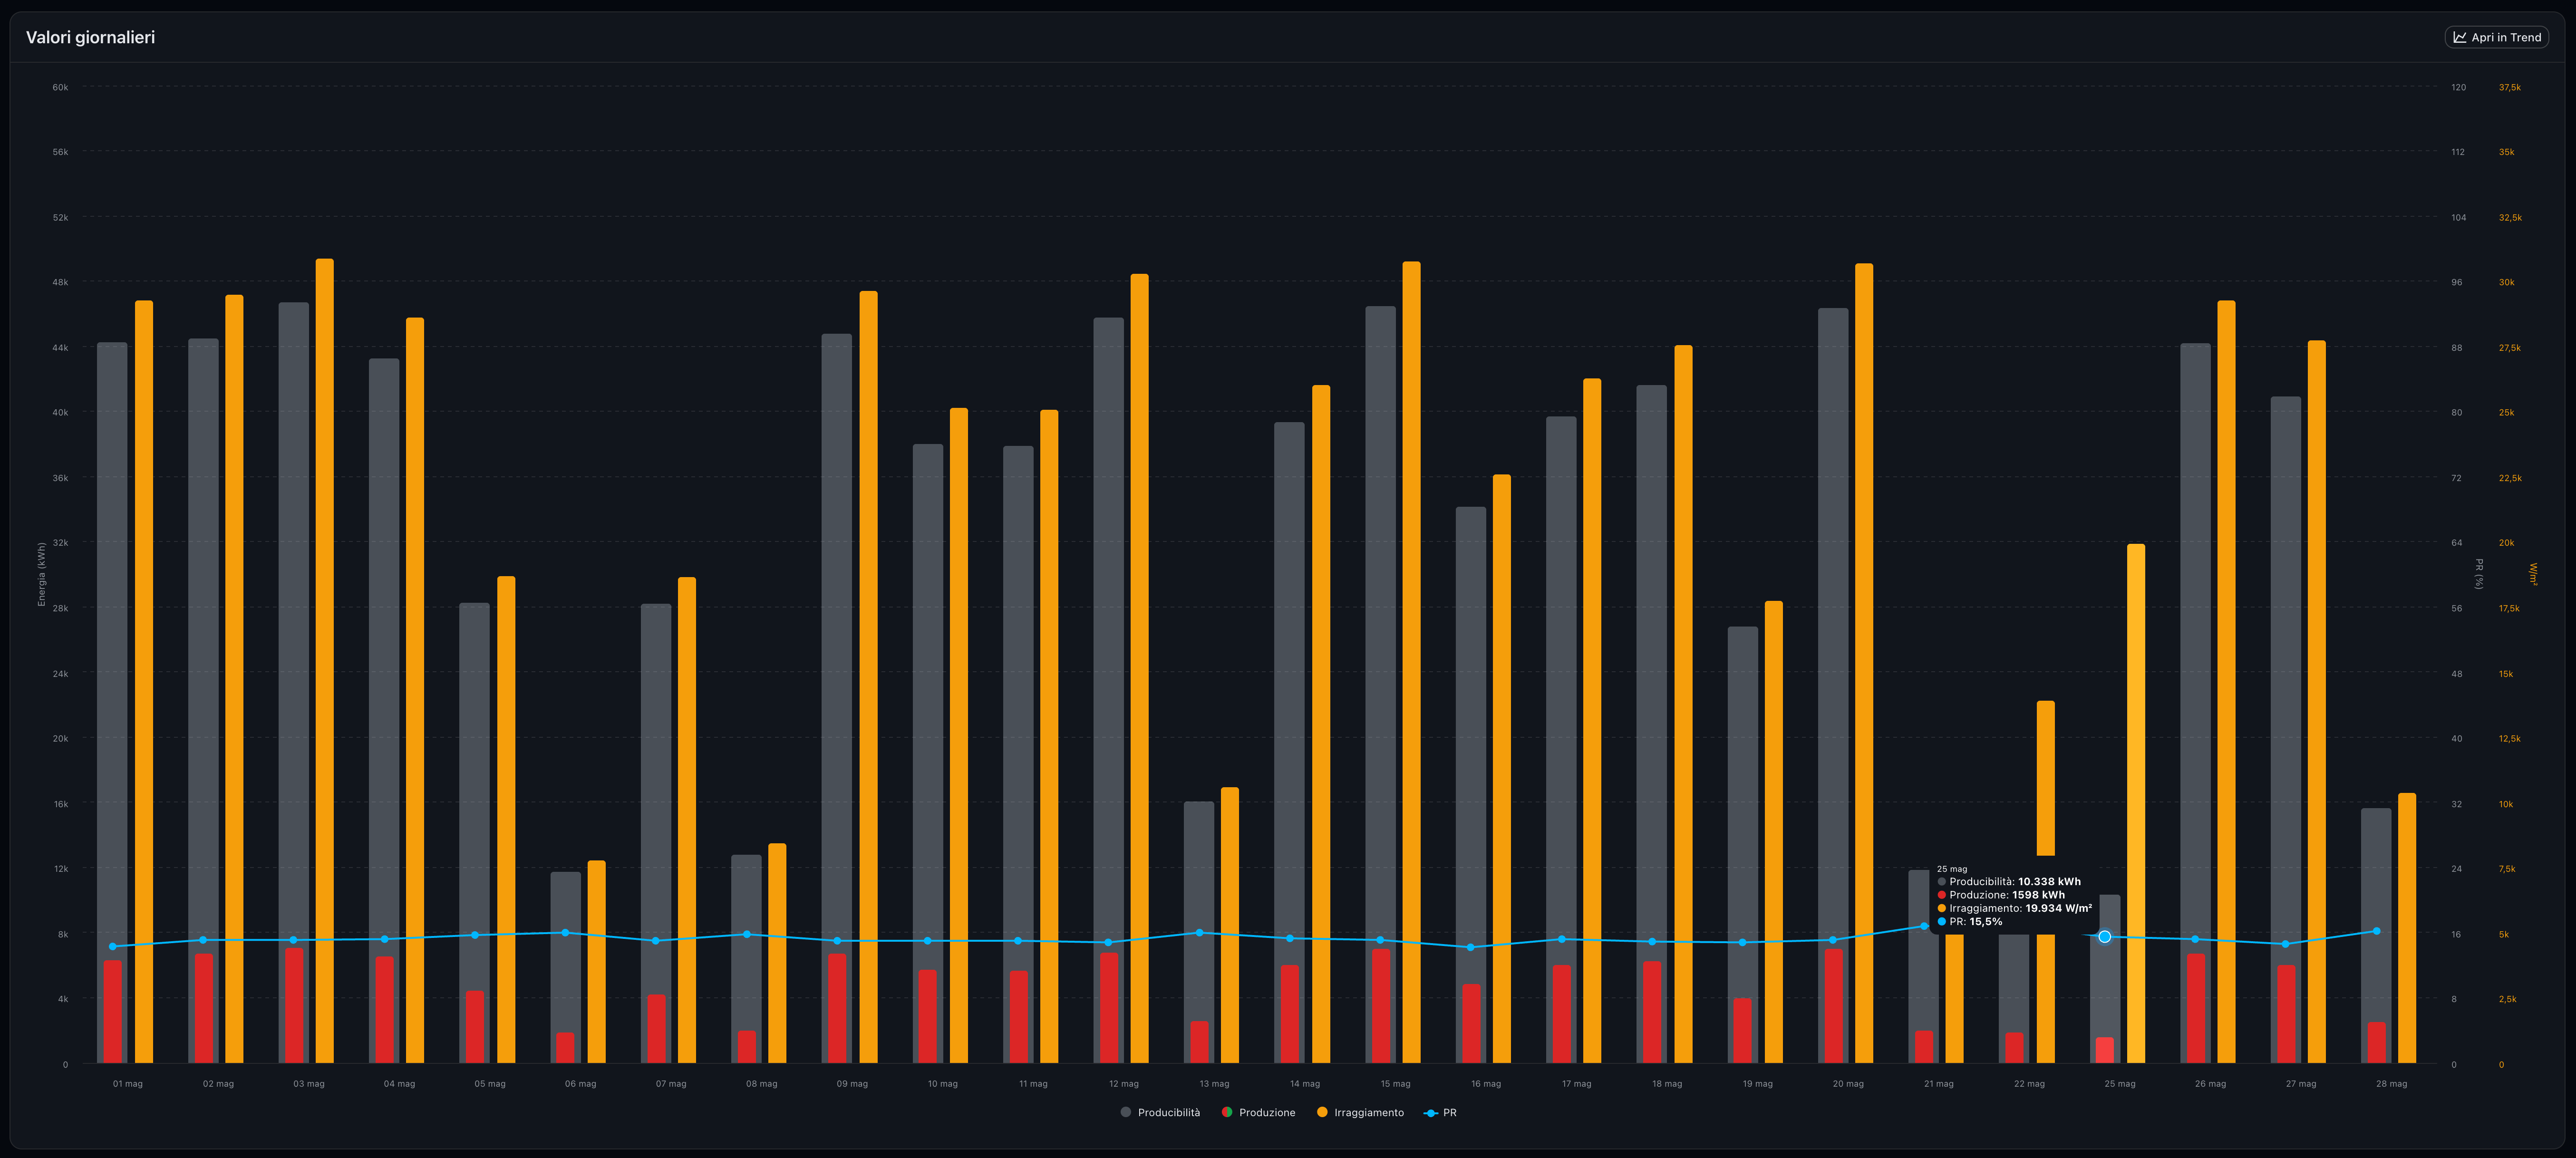
Hover the chart to read the value of each day.
The Open in Trend button at the top right of the chart jumps to the Trend page with the underlying signals pre-selected and the current date range: useful to inspect the raw measurements (irradiation, temperature, production) behind every point.
Custom sources
The Sources drawer lets you replace one or more of the four default sources used by the calculation. For each family (Production, Irradiation, Module Temperature, Ambient Temperature) you can choose:
- Default — the signal automatically resolved by the system.
- Custom — a specific tag, picked manually.
The Default Irradiation source is the plant irradiation computed from the technical sensors, not the reading of a single sensor.
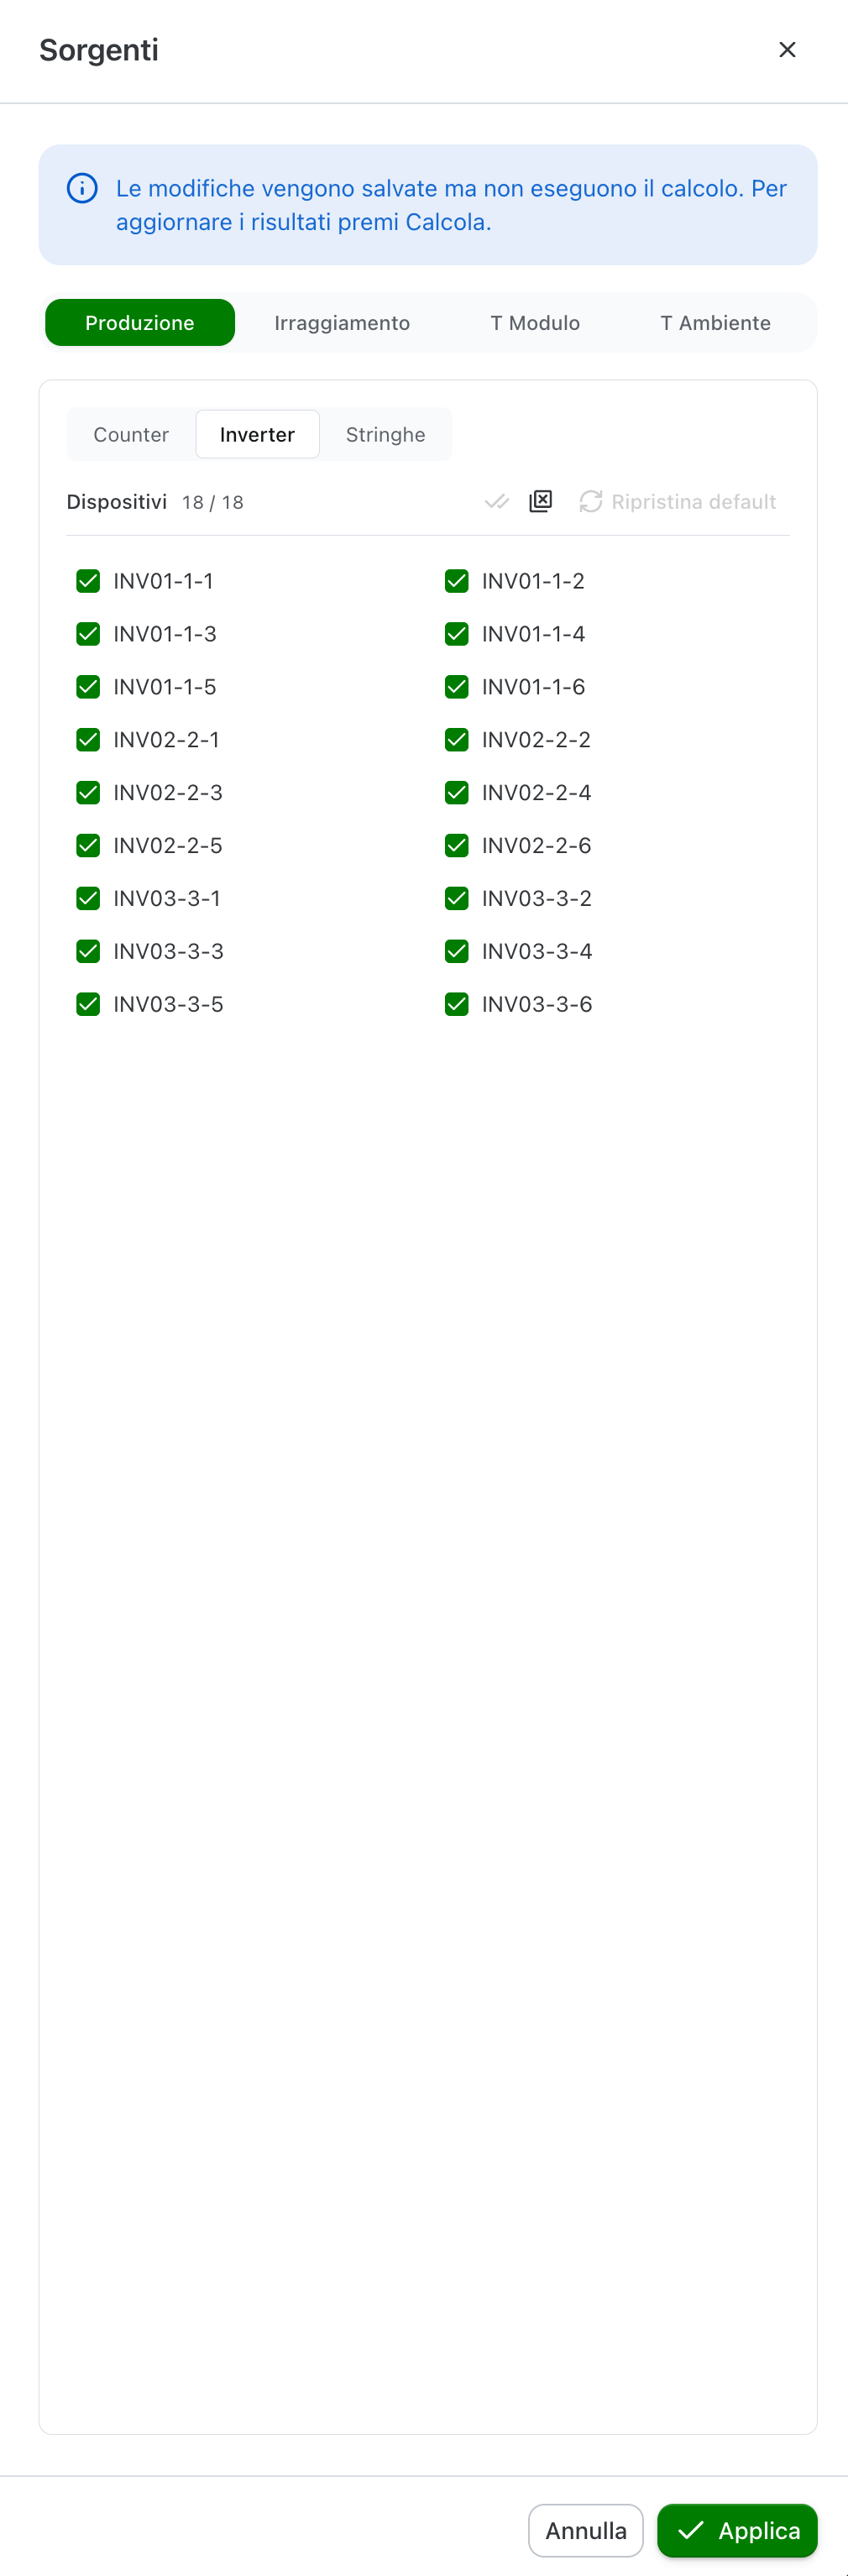
When the drawer is closed with Apply, the calculation is re-run with the new configuration and the Custom badge appears in the toolbar. A custom source is valid only for the current working session unless it is saved as a snapshot.
CSV export
The CSV button downloads a file with the daily PR detail and the period aggregates. The file contains:
- a header comment with
# Plant: <name>and# Range: <from> → <to>; - a header row with
Date | PR | Produced energy | Producible energy | Irradiation; - one row per day in the period;
- a final summary block with the same KPIs as the strip.
Numbers are formatted in the user's locale.