
Downtime manager
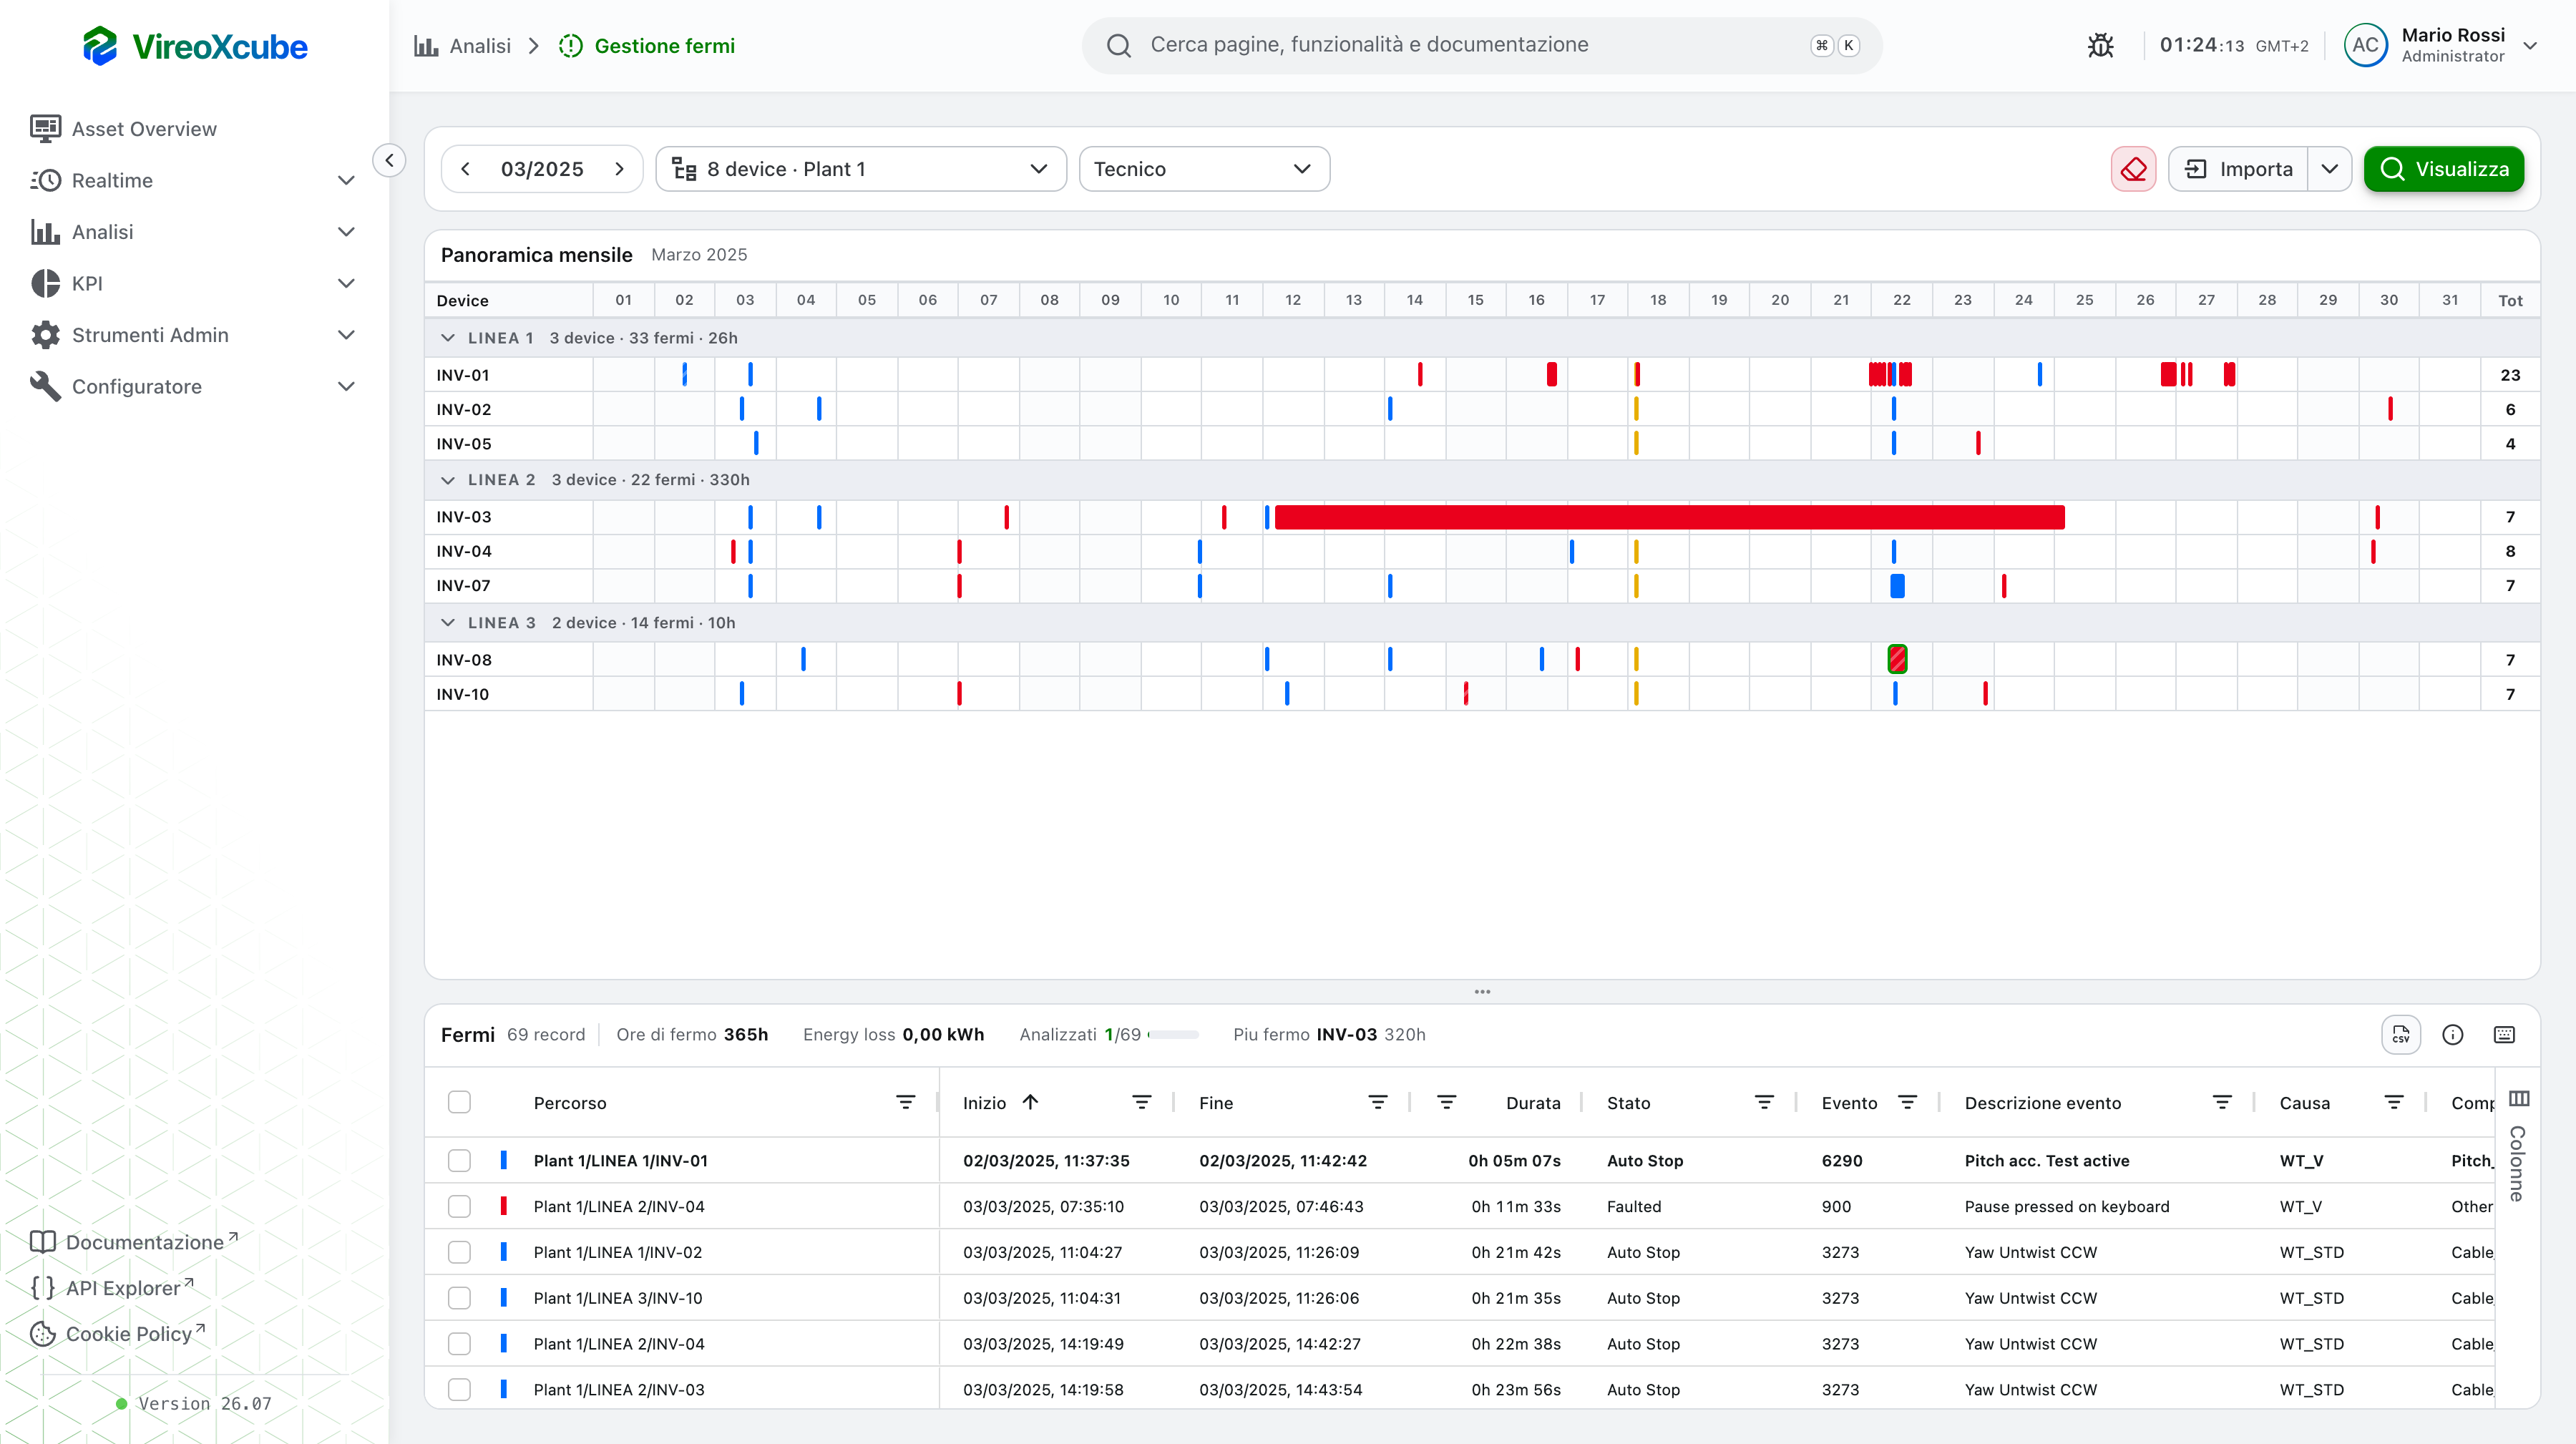
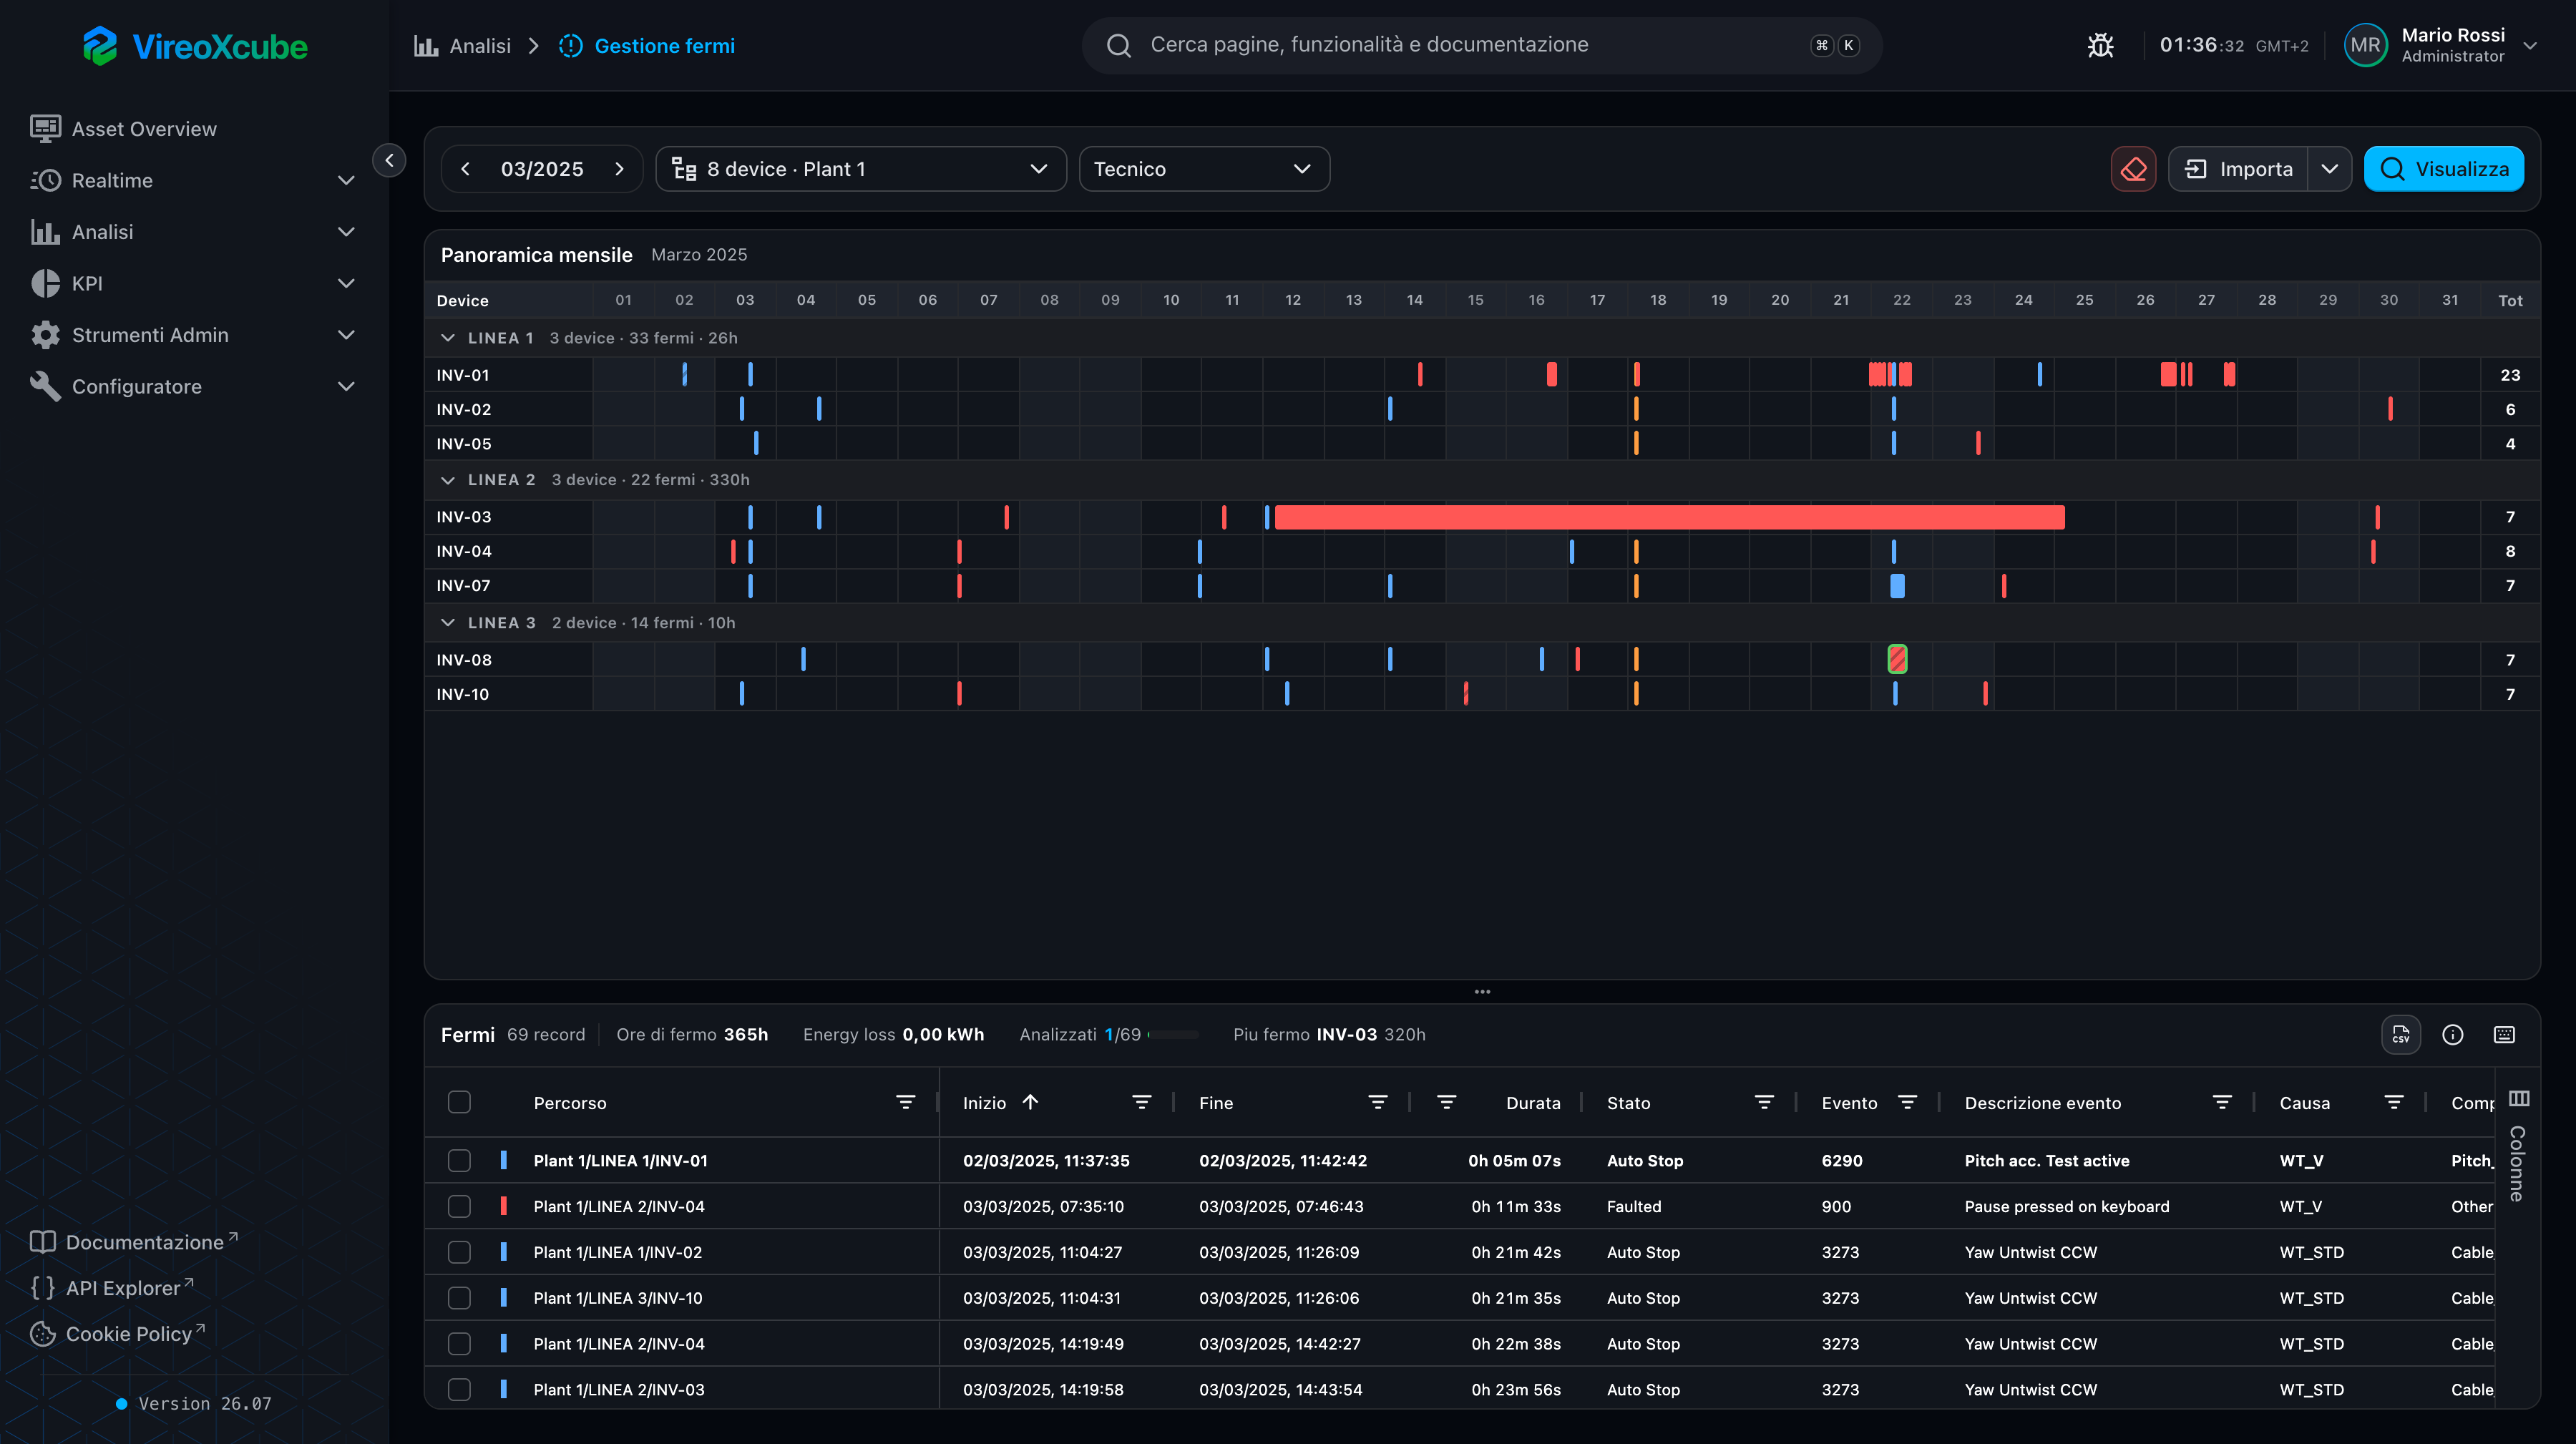
The Downtime manager page shows the downtimes of a plant's devices over one month: when a device stopped, for how long, in which state and for which event. It is meant for whoever checks and corrects the downtimes computed by the system: you can analyse, edit, split, group, add and delete them, and recompute them from device data with a preview before saving.
How it works
The page has three states:
- Initial state — your latest analyses (recents) and a few ready-made ones, over the skeleton of the page. The toolbar is already active.
- Loading — after View the page shows the skeleton of calendar and table until the downtimes arrive.
- Ready — calendar, table and summaries are complete.
Changing month or devices after a search redraws nothing: a dot on View tells you that what you see no longer matches the toolbar, until you press it again.
Page flow
- Pick the month — the toolbar selector starts on the current month.
- Pick the devices — from the tree, one or more devices of the same plant. The label shows how many and which plant.
- View — loads the downtimes of the month.
- Read the calendar — one row per device, grouped by section, one bar per downtime coloured by cause.
- Filter — from the calendar (device, day, cell, bar) or from the table column filters. Active filters show up as chips.
- Select — with click, Ctrl/Cmd + click, Shift + click, area selection on the calendar or from the keyboard.
- Fix — from the context menu, the detail buttons or the shortcuts: edit, split, group, delete, analysed.
- Import — recompute the downtimes from device data and check the differences in a preview before saving.
Toolbar
| Control | Description |
|---|---|
| Month | The month analysed. Arrows ‹ › move one month; Alt + ← / → from the keyboard. |
| Devices | Plant tree with multiple selection. The first device picked fixes the plant: the other plants become disabled. |
| Clear | Empties results, filters and selection and cancels a running recompute. Month and devices stay. |
| Import | Recomputes the month's downtimes from device data, with a preview. From the side menu: Add downtime. |
| View | Loads the downtimes. A warning dot appears when month or devices changed since the last search. |
Calendar
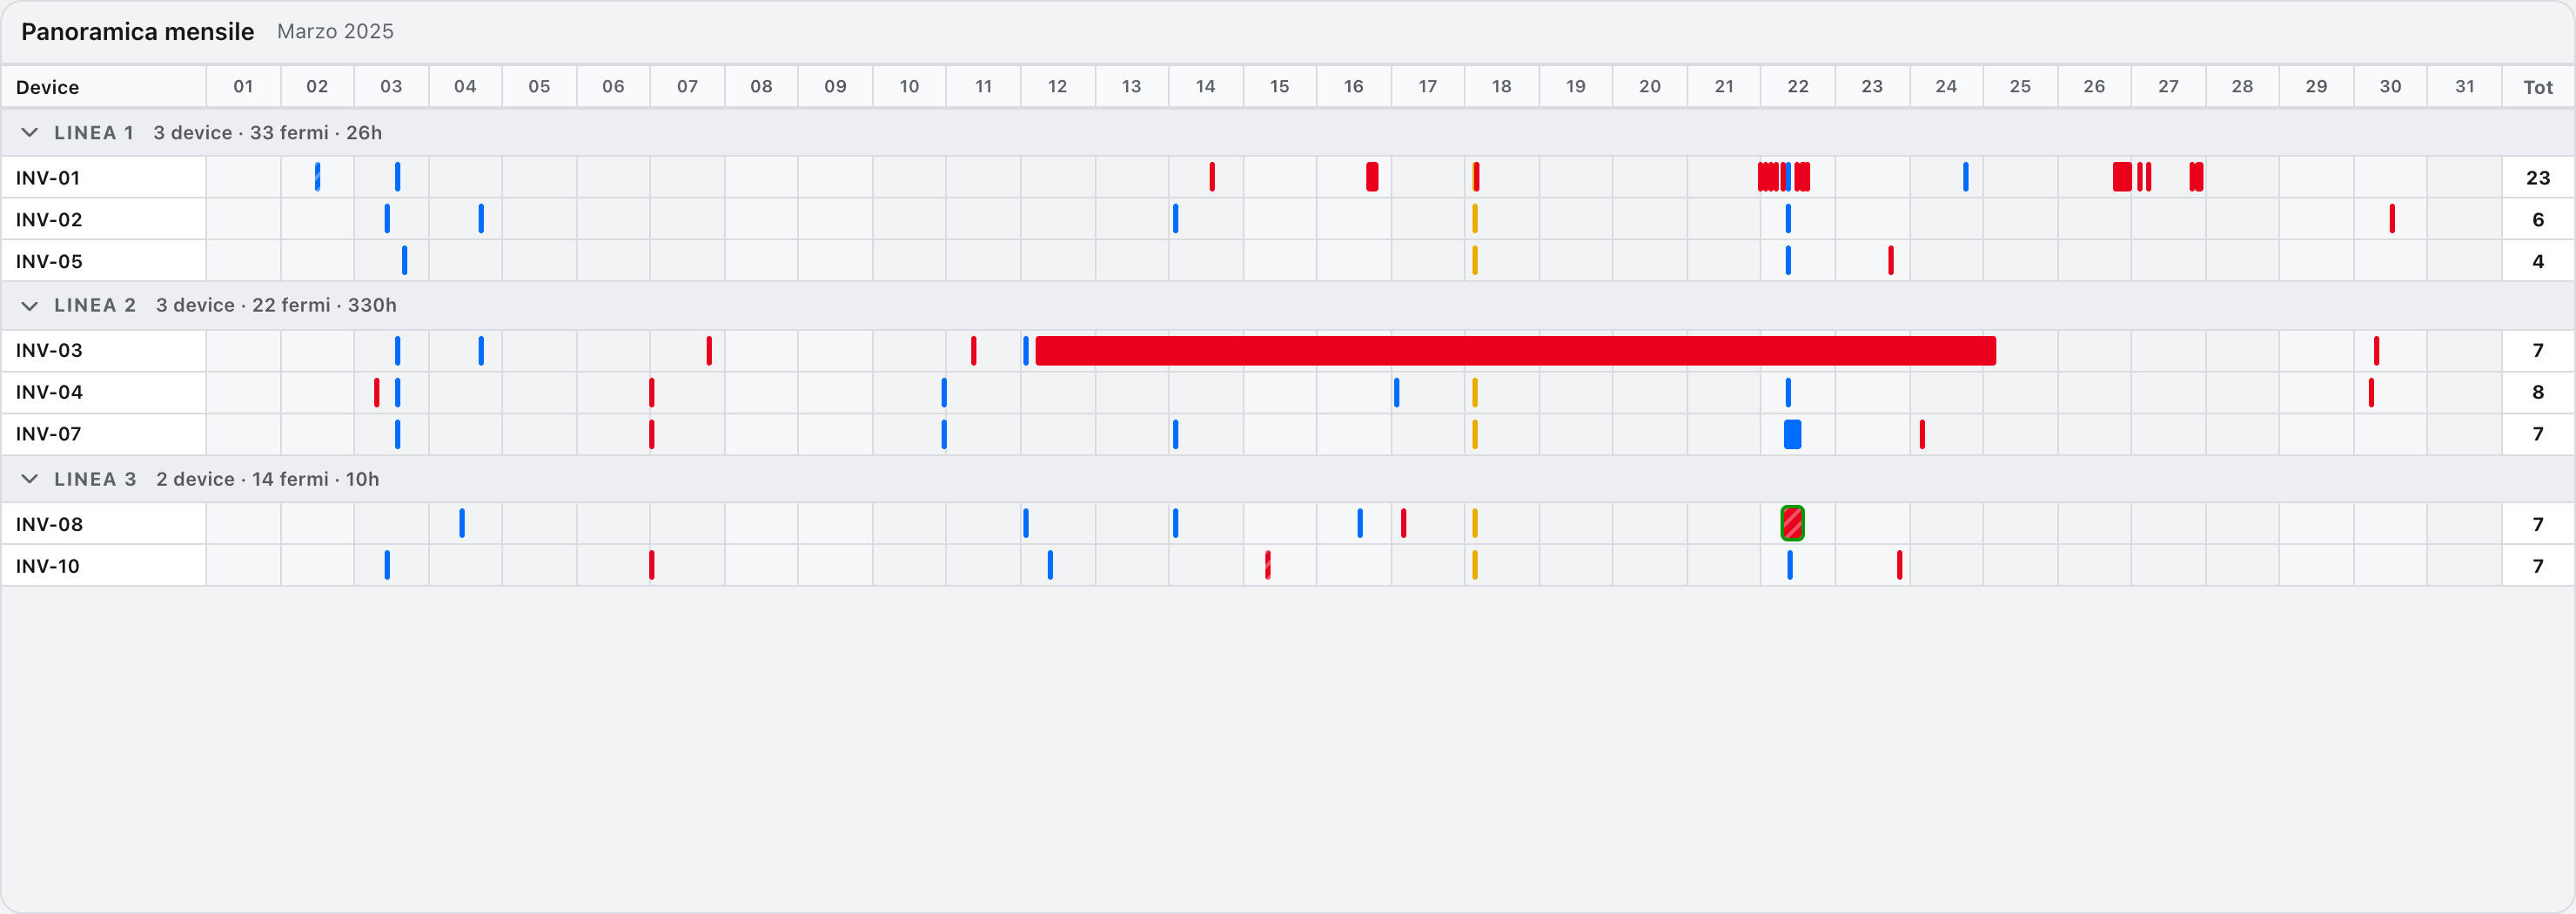
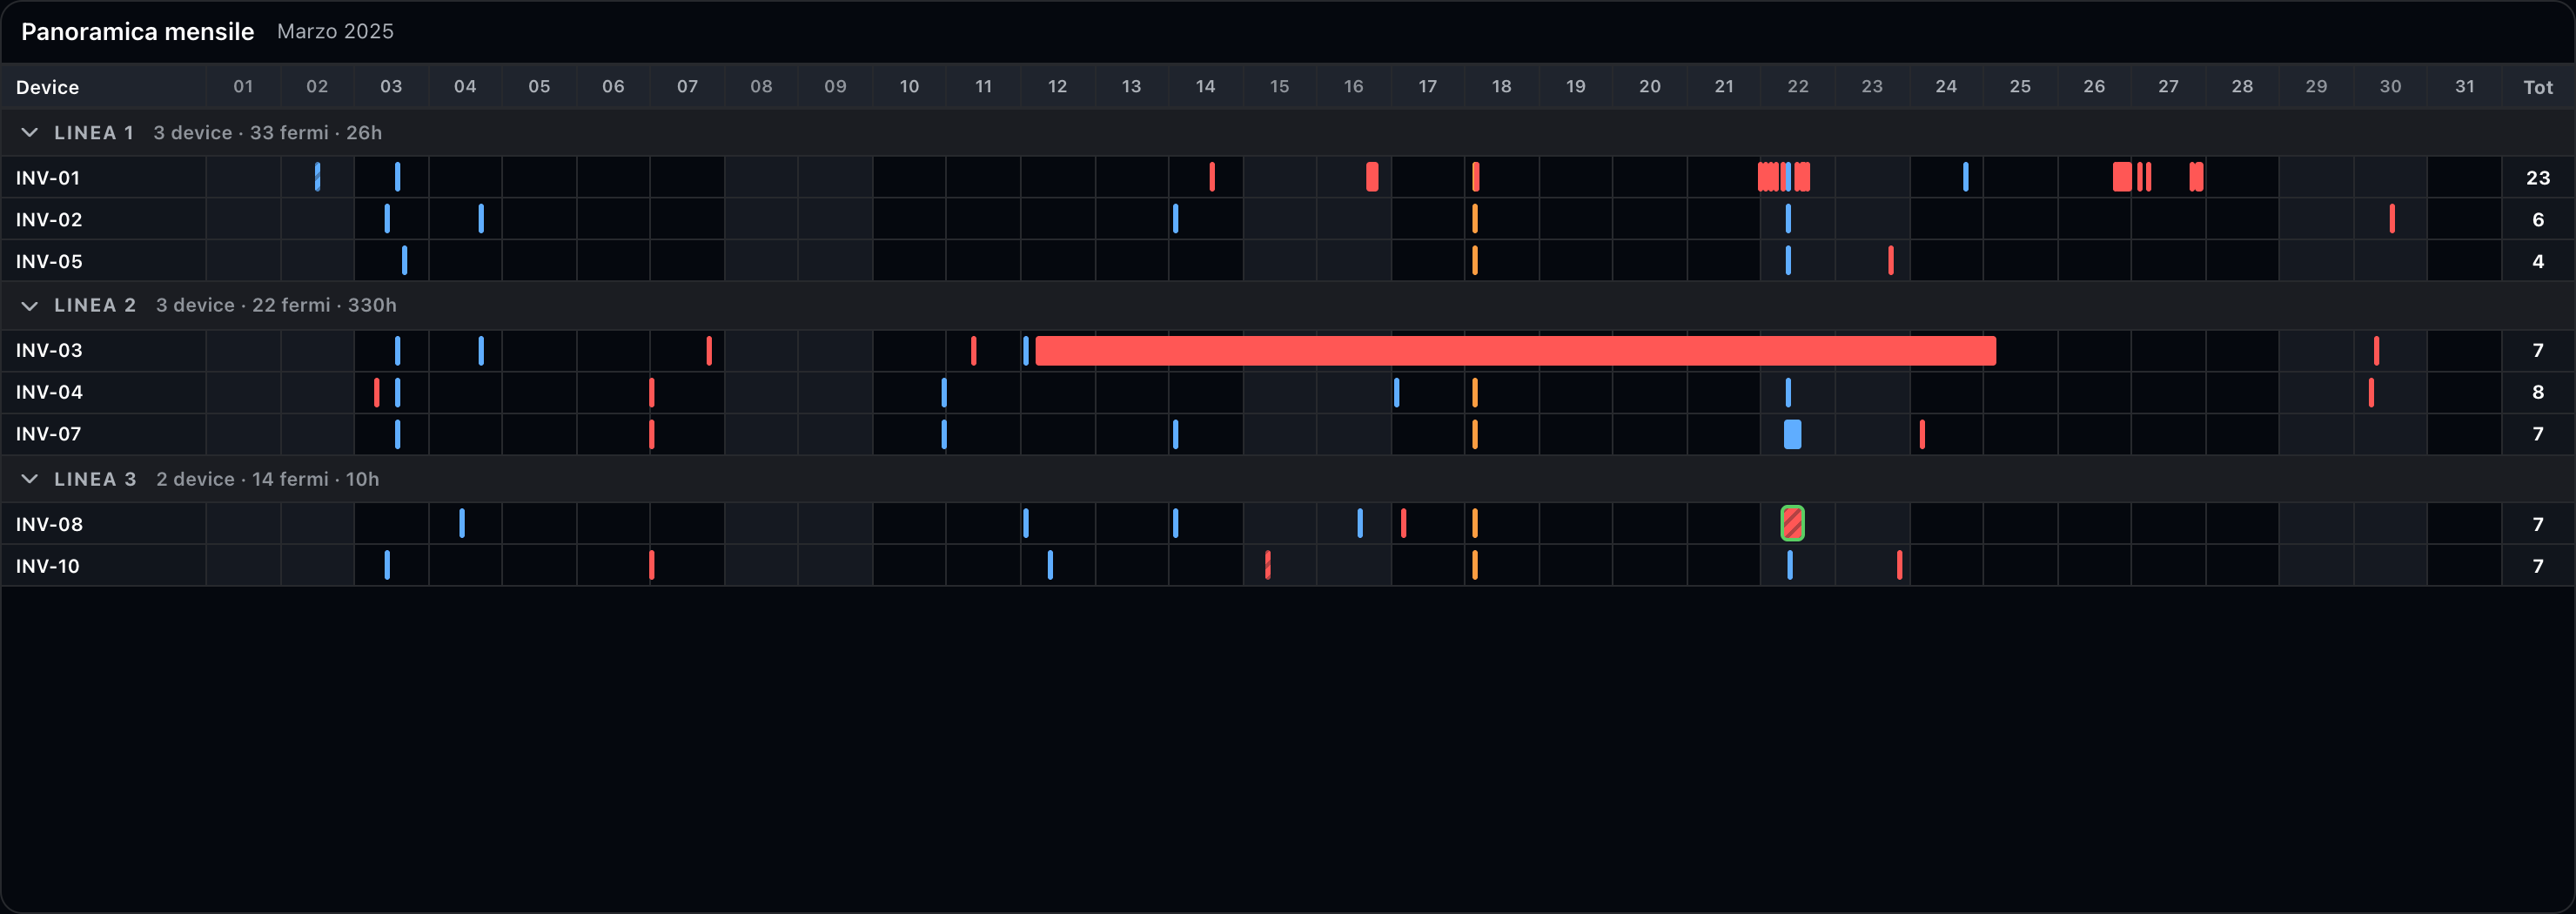
Each row is a device, grouped by section (sections collapse with a click). Each downtime is a bar proportional to its duration, in the colour of its cause. The cause comes from the downtime's event code, looked up in the error code list of the device model; downtimes with no event code, or on devices with no error code list, stay grey and appear in the legend as «No cause». Each cause's colour is generated from its name, so the same cause always gets the same colour. The right column shows the device's downtime hours in the month.
Markers on the bars:
- Green border — analysed downtime.
- Magenta border — still ongoing, no end yet.
- Hatching — edited by hand: the recompute preserves it.
Every click on the calendar clears the filters and leaves only its own:
| Click on | Effect |
|---|---|
| Device name | Only that device's downtimes. |
| Day number | The downtimes touching that day, even for a second. |
| Device × day cell | Both filters together. |
| Bar | Selects the downtime. Ctrl/Cmd + click adds to the selection, Shift + click extends it, a second click deselects. Double-click opens the detail, right-click the menu. |
| Drag | Area selection: takes every bar inside the rectangle. |
Table


In the header: record count, downtime hours, energy loss, analysed with a progress bar and the most stopped device. Summaries are computed on the visible rows, so they follow the filters.
The default columns are Path, start, stop, duration, state, event with description, cause, component, energy loss, note, analysed and edited by. Plant, section and device are separate columns you can enable from the column panel. Every column has its own filter; active filters show up as chips under the header, removable one by one or all at once.
On the right, three icons: legend of causes and markers, export CSV (the visible rows) and shortcuts. The coloured vertical strip at the start of each table row repeats the cause colour, so table and calendar read together.
Operations on downtimes
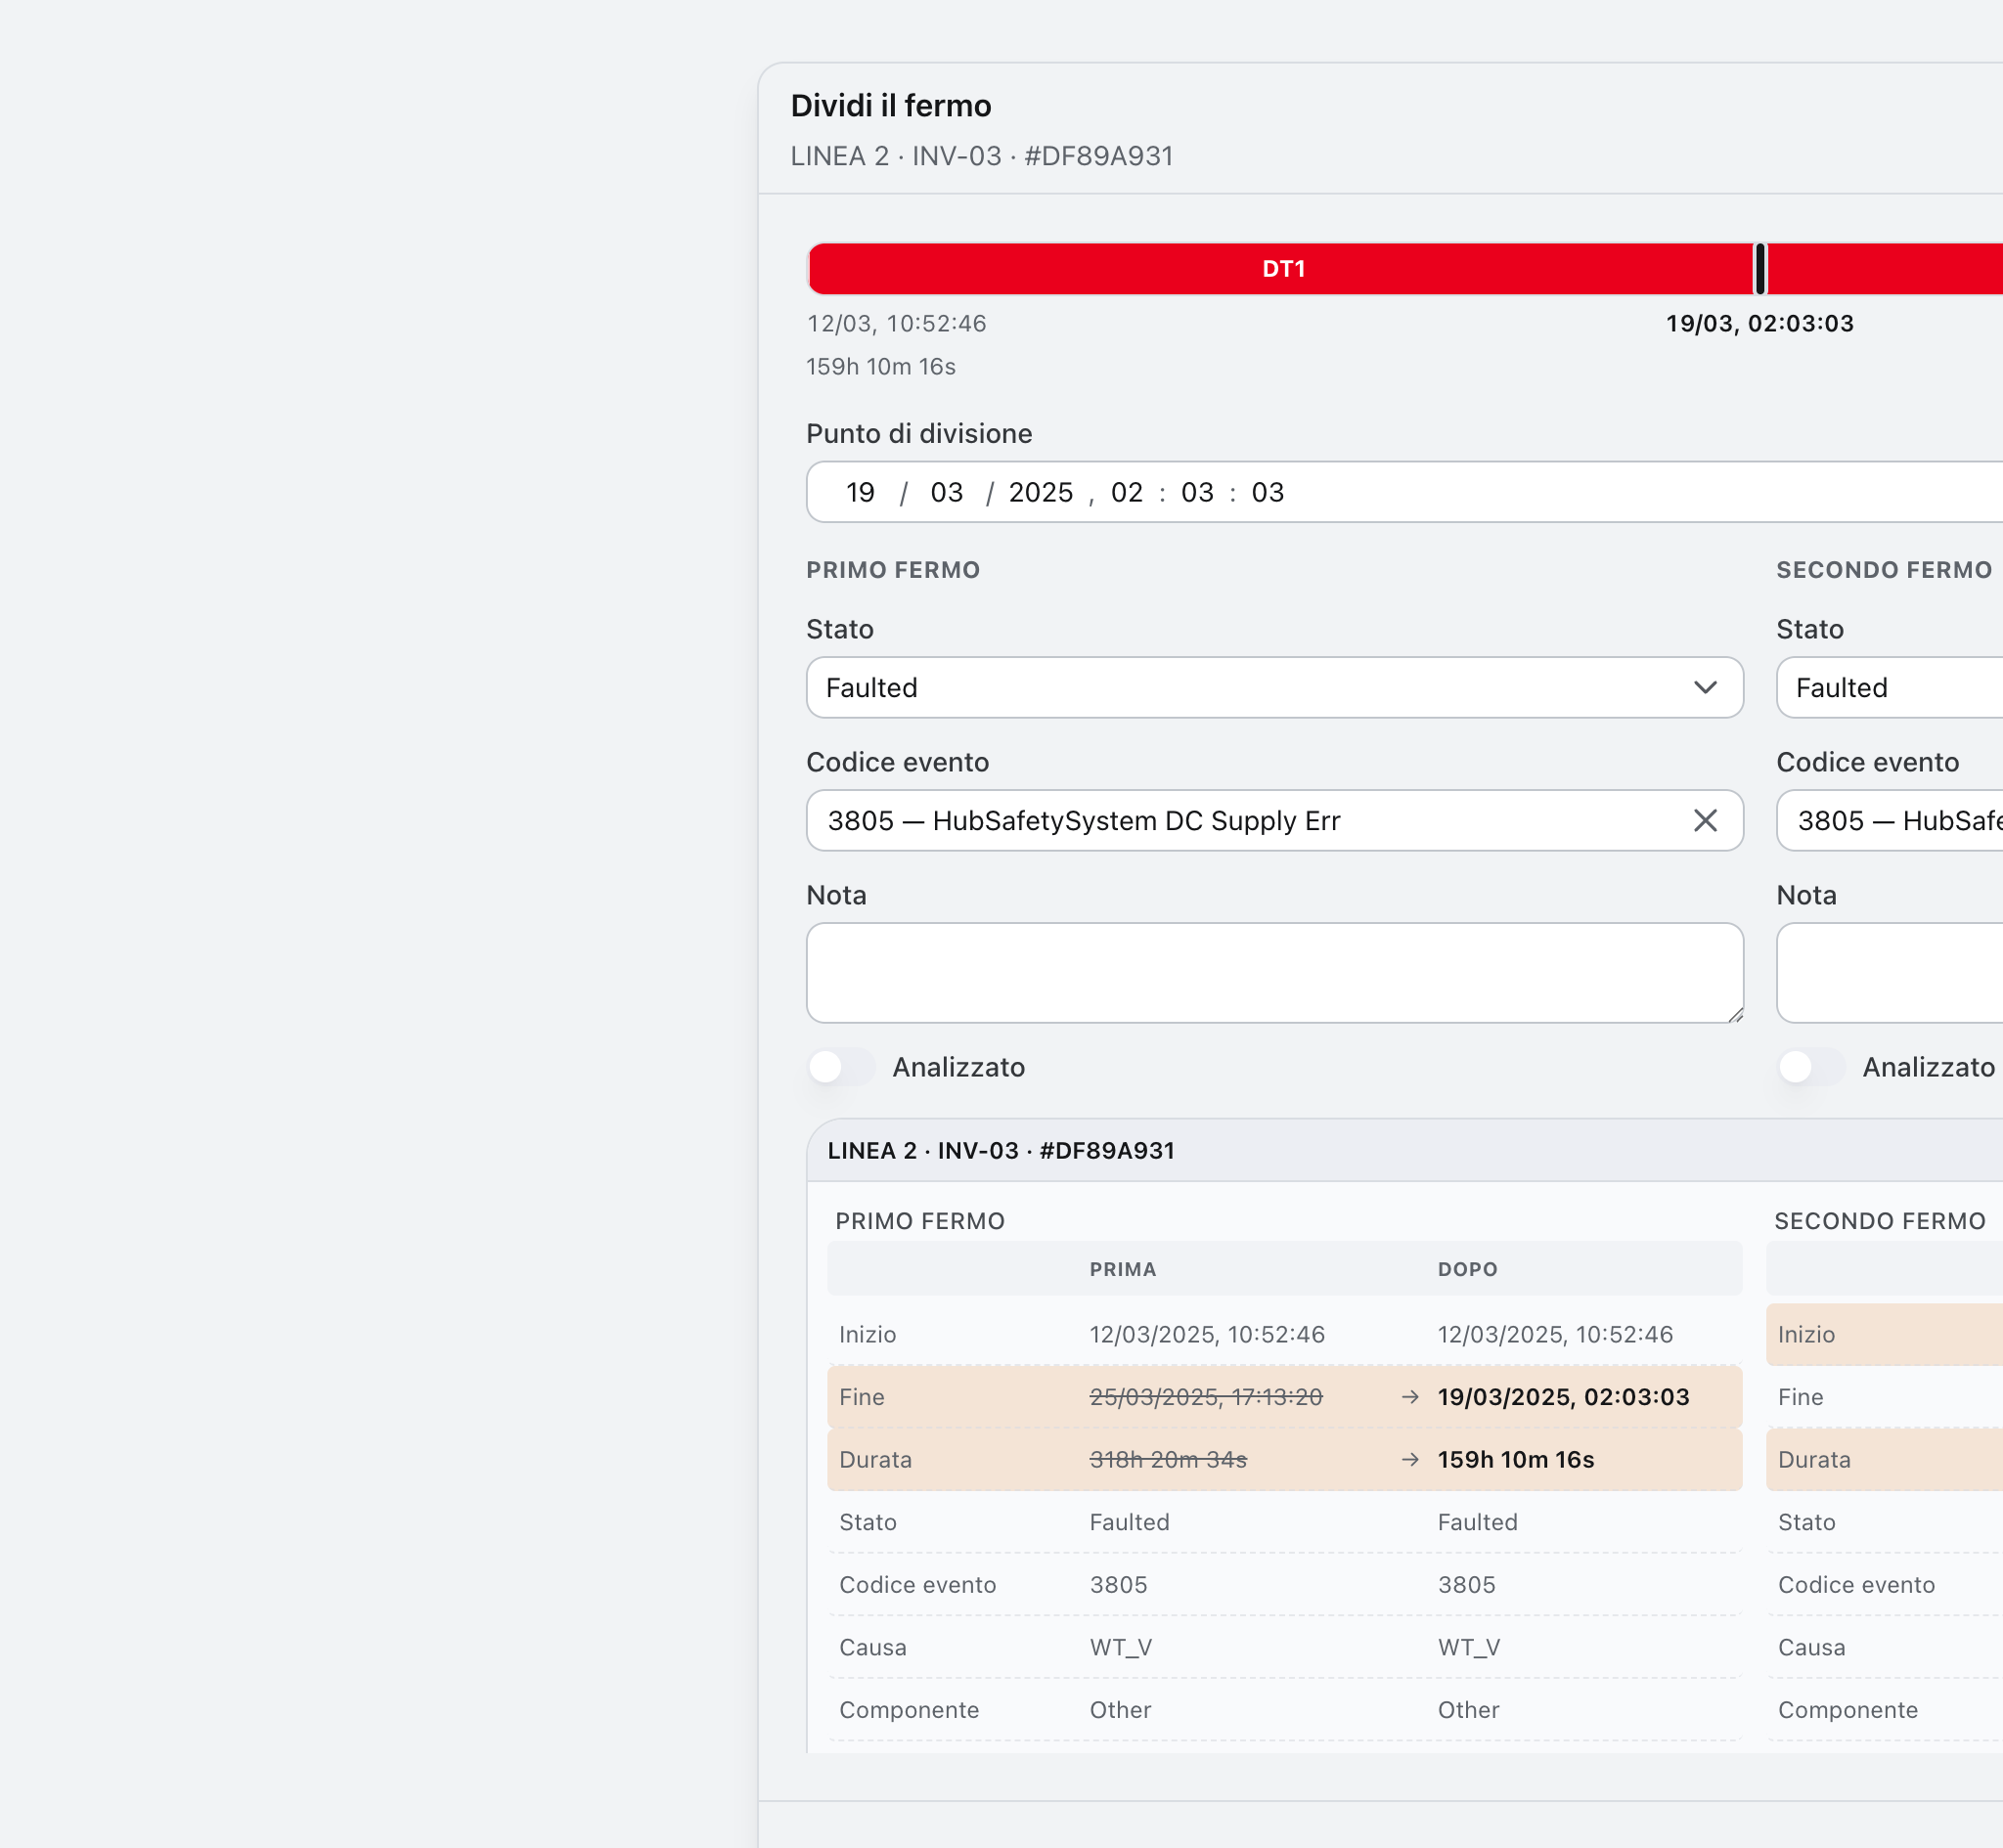
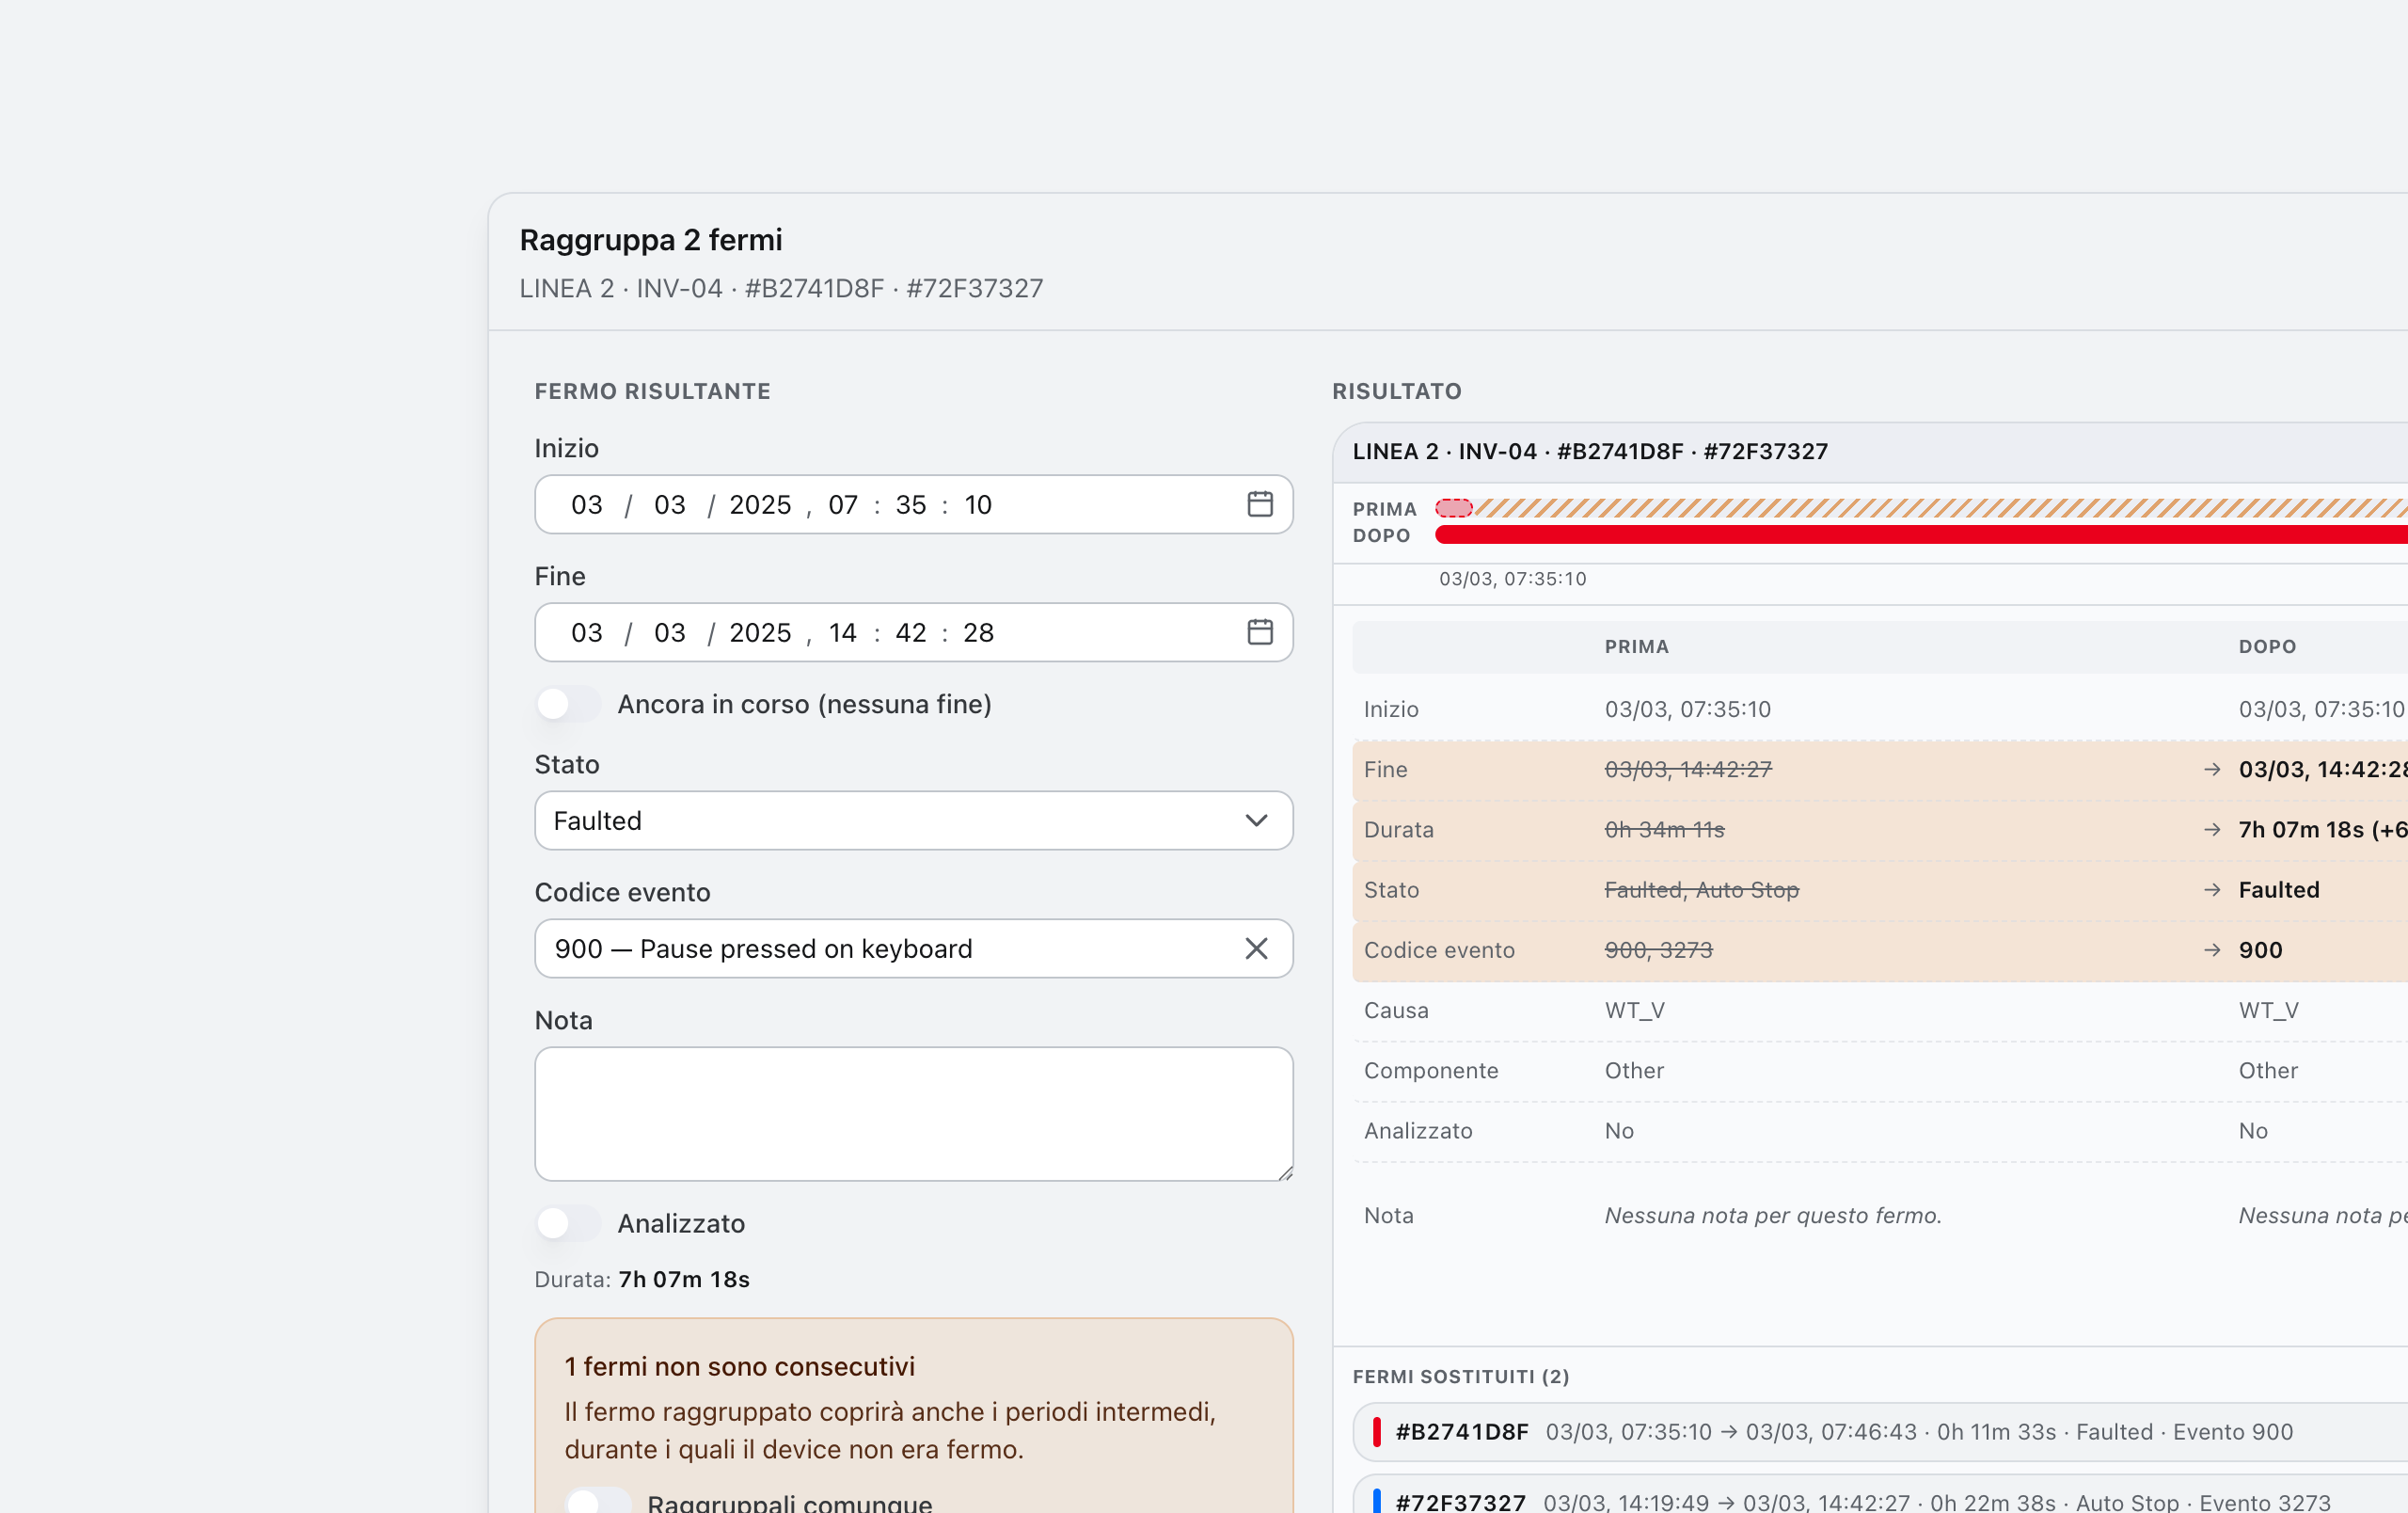
Every operation shows a Before / After preview and every delete asks for confirmation. The duration is always derived from start and stop; the energy loss is computed by the server after saving and never appears in previews.
| Operation | From | What it does |
|---|---|---|
| Add | Import → Add downtime, key N | A new downtime on one or more devices. The fill holes only option inserts it only where the device is not already stopped. |
| Edit | Detail, menu, key E | Start, stop or ongoing, state, event code, note, analysed. |
| Bulk edit | Selection of several downtimes, key E | Same fields on several downtimes. Untouched fields stay as they were on each one; dates can only change with one downtime per device. |
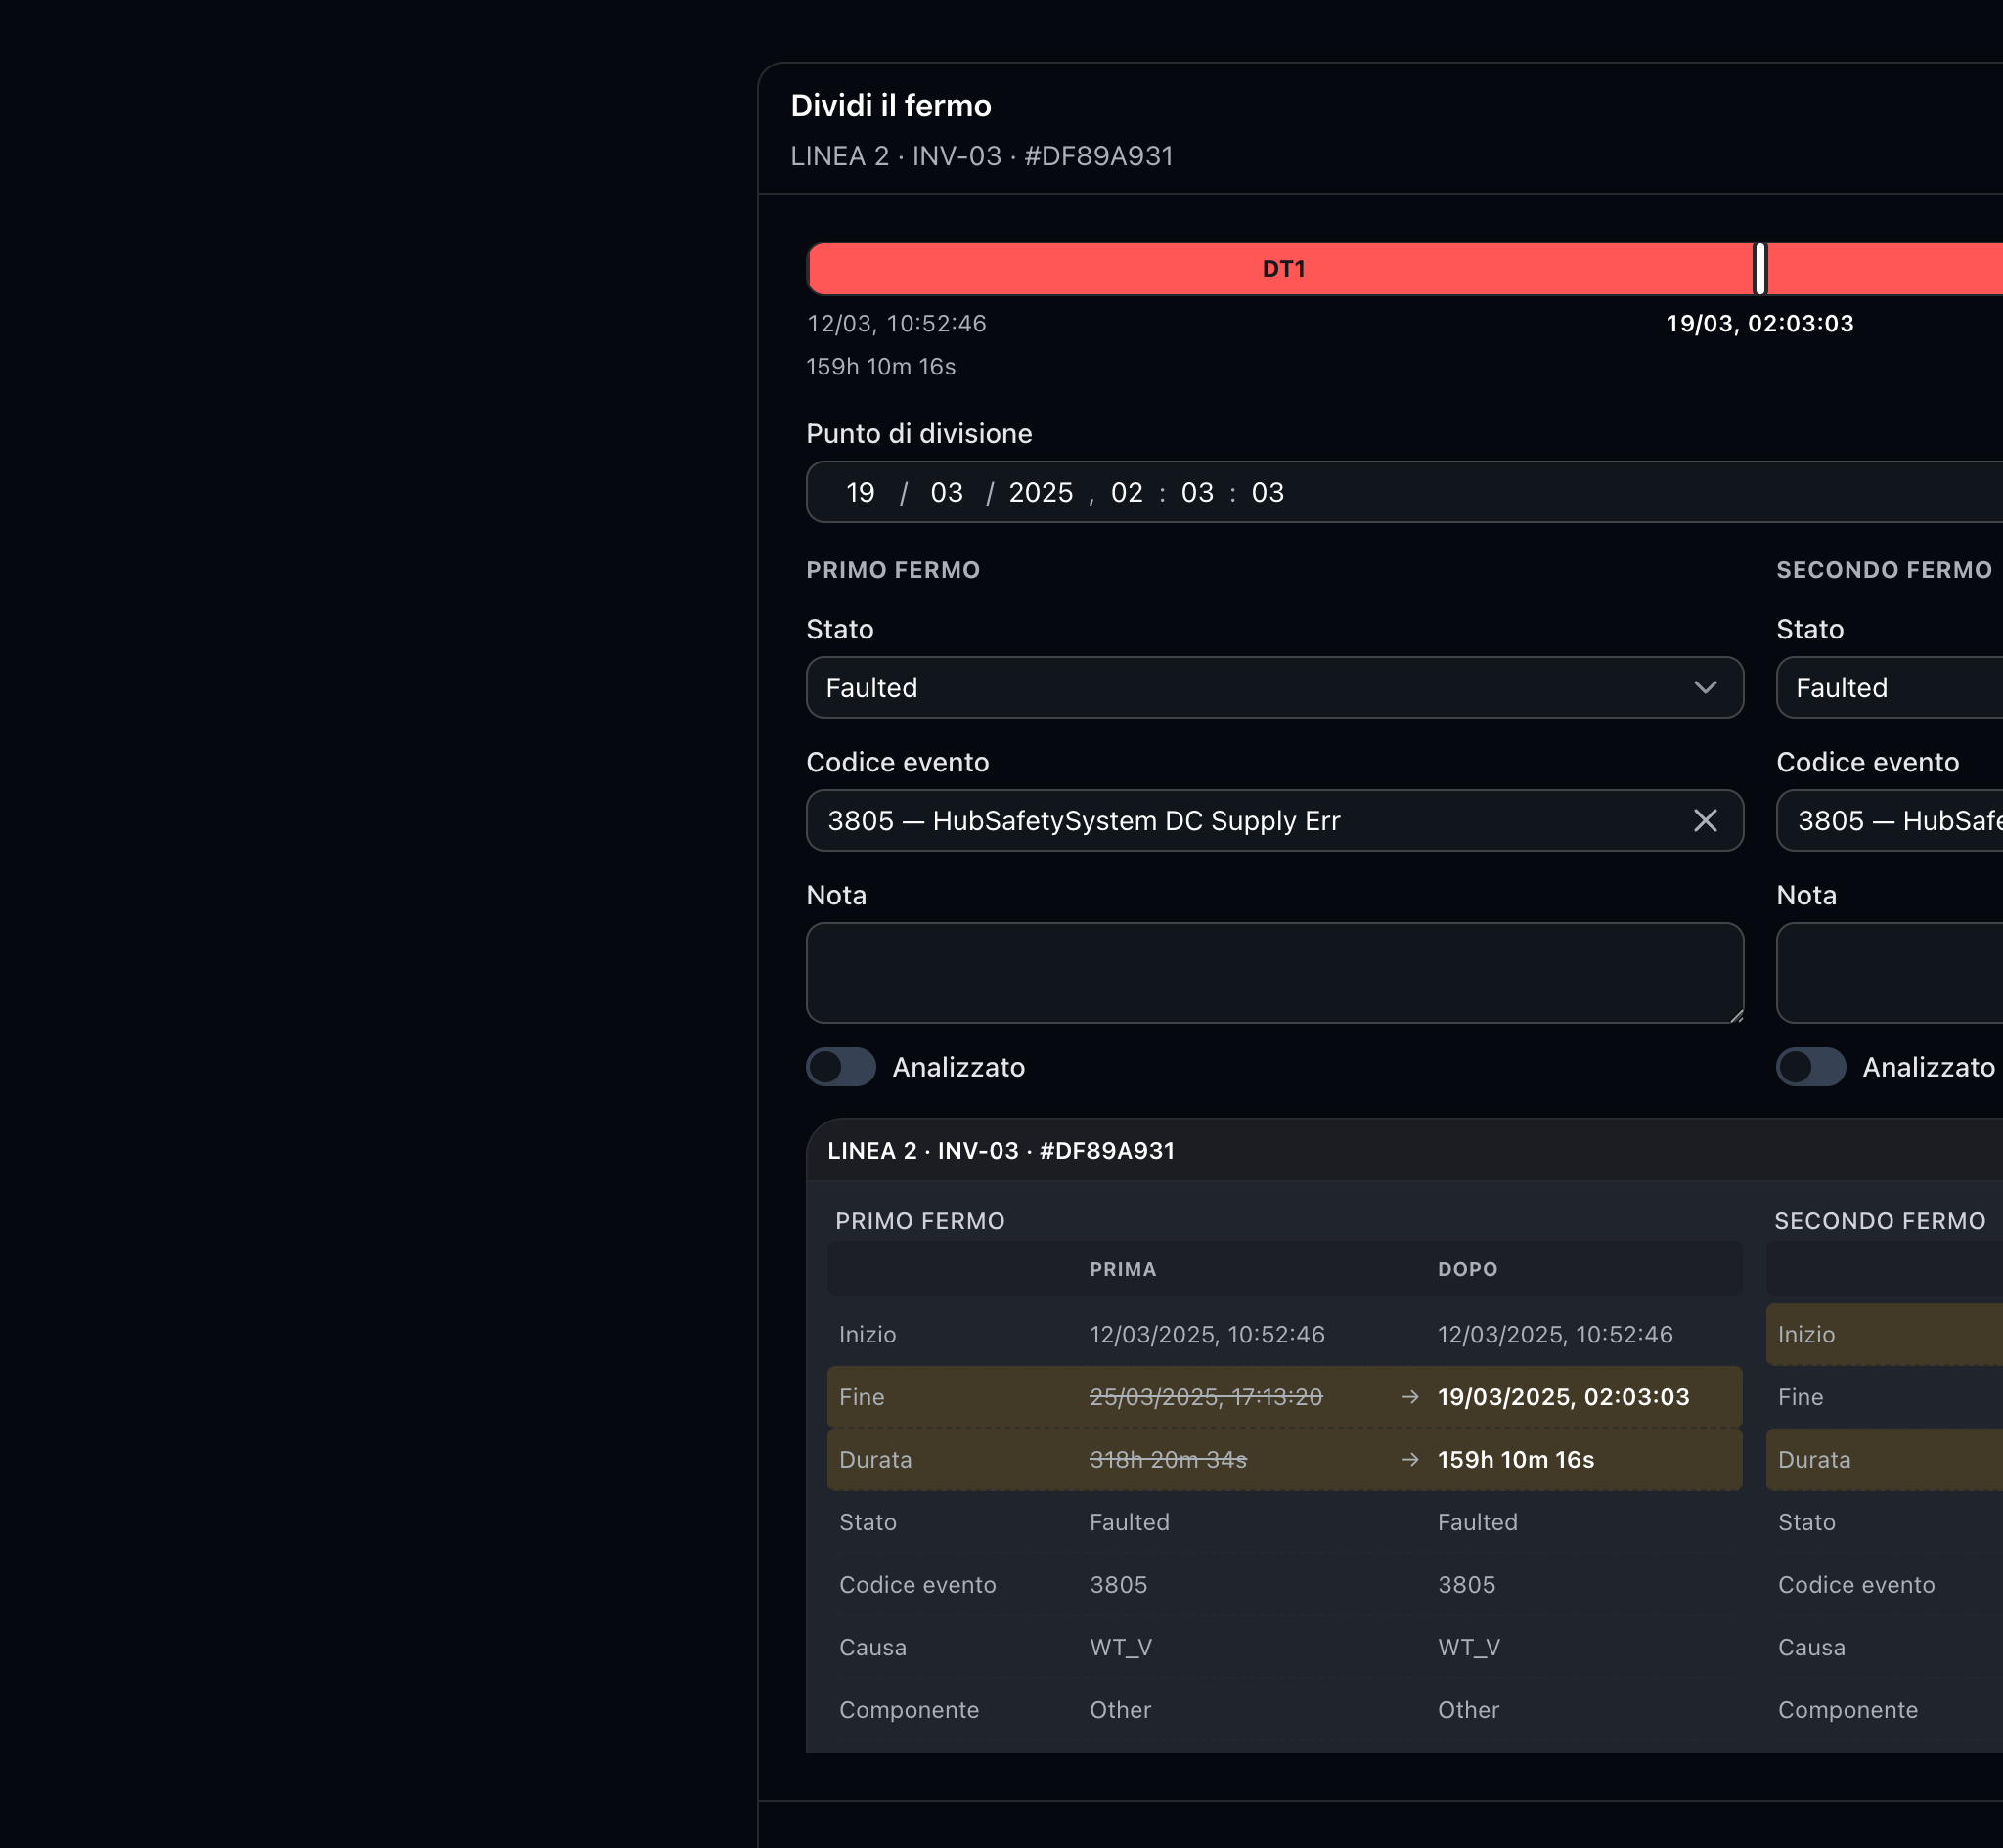
| Split | Detail, menu, key S | Cuts a downtime in two at the chosen point. The device's state changes in the period are marked on the timeline and listed in the «State changes» menu: dragging the handle near one snaps to it. |
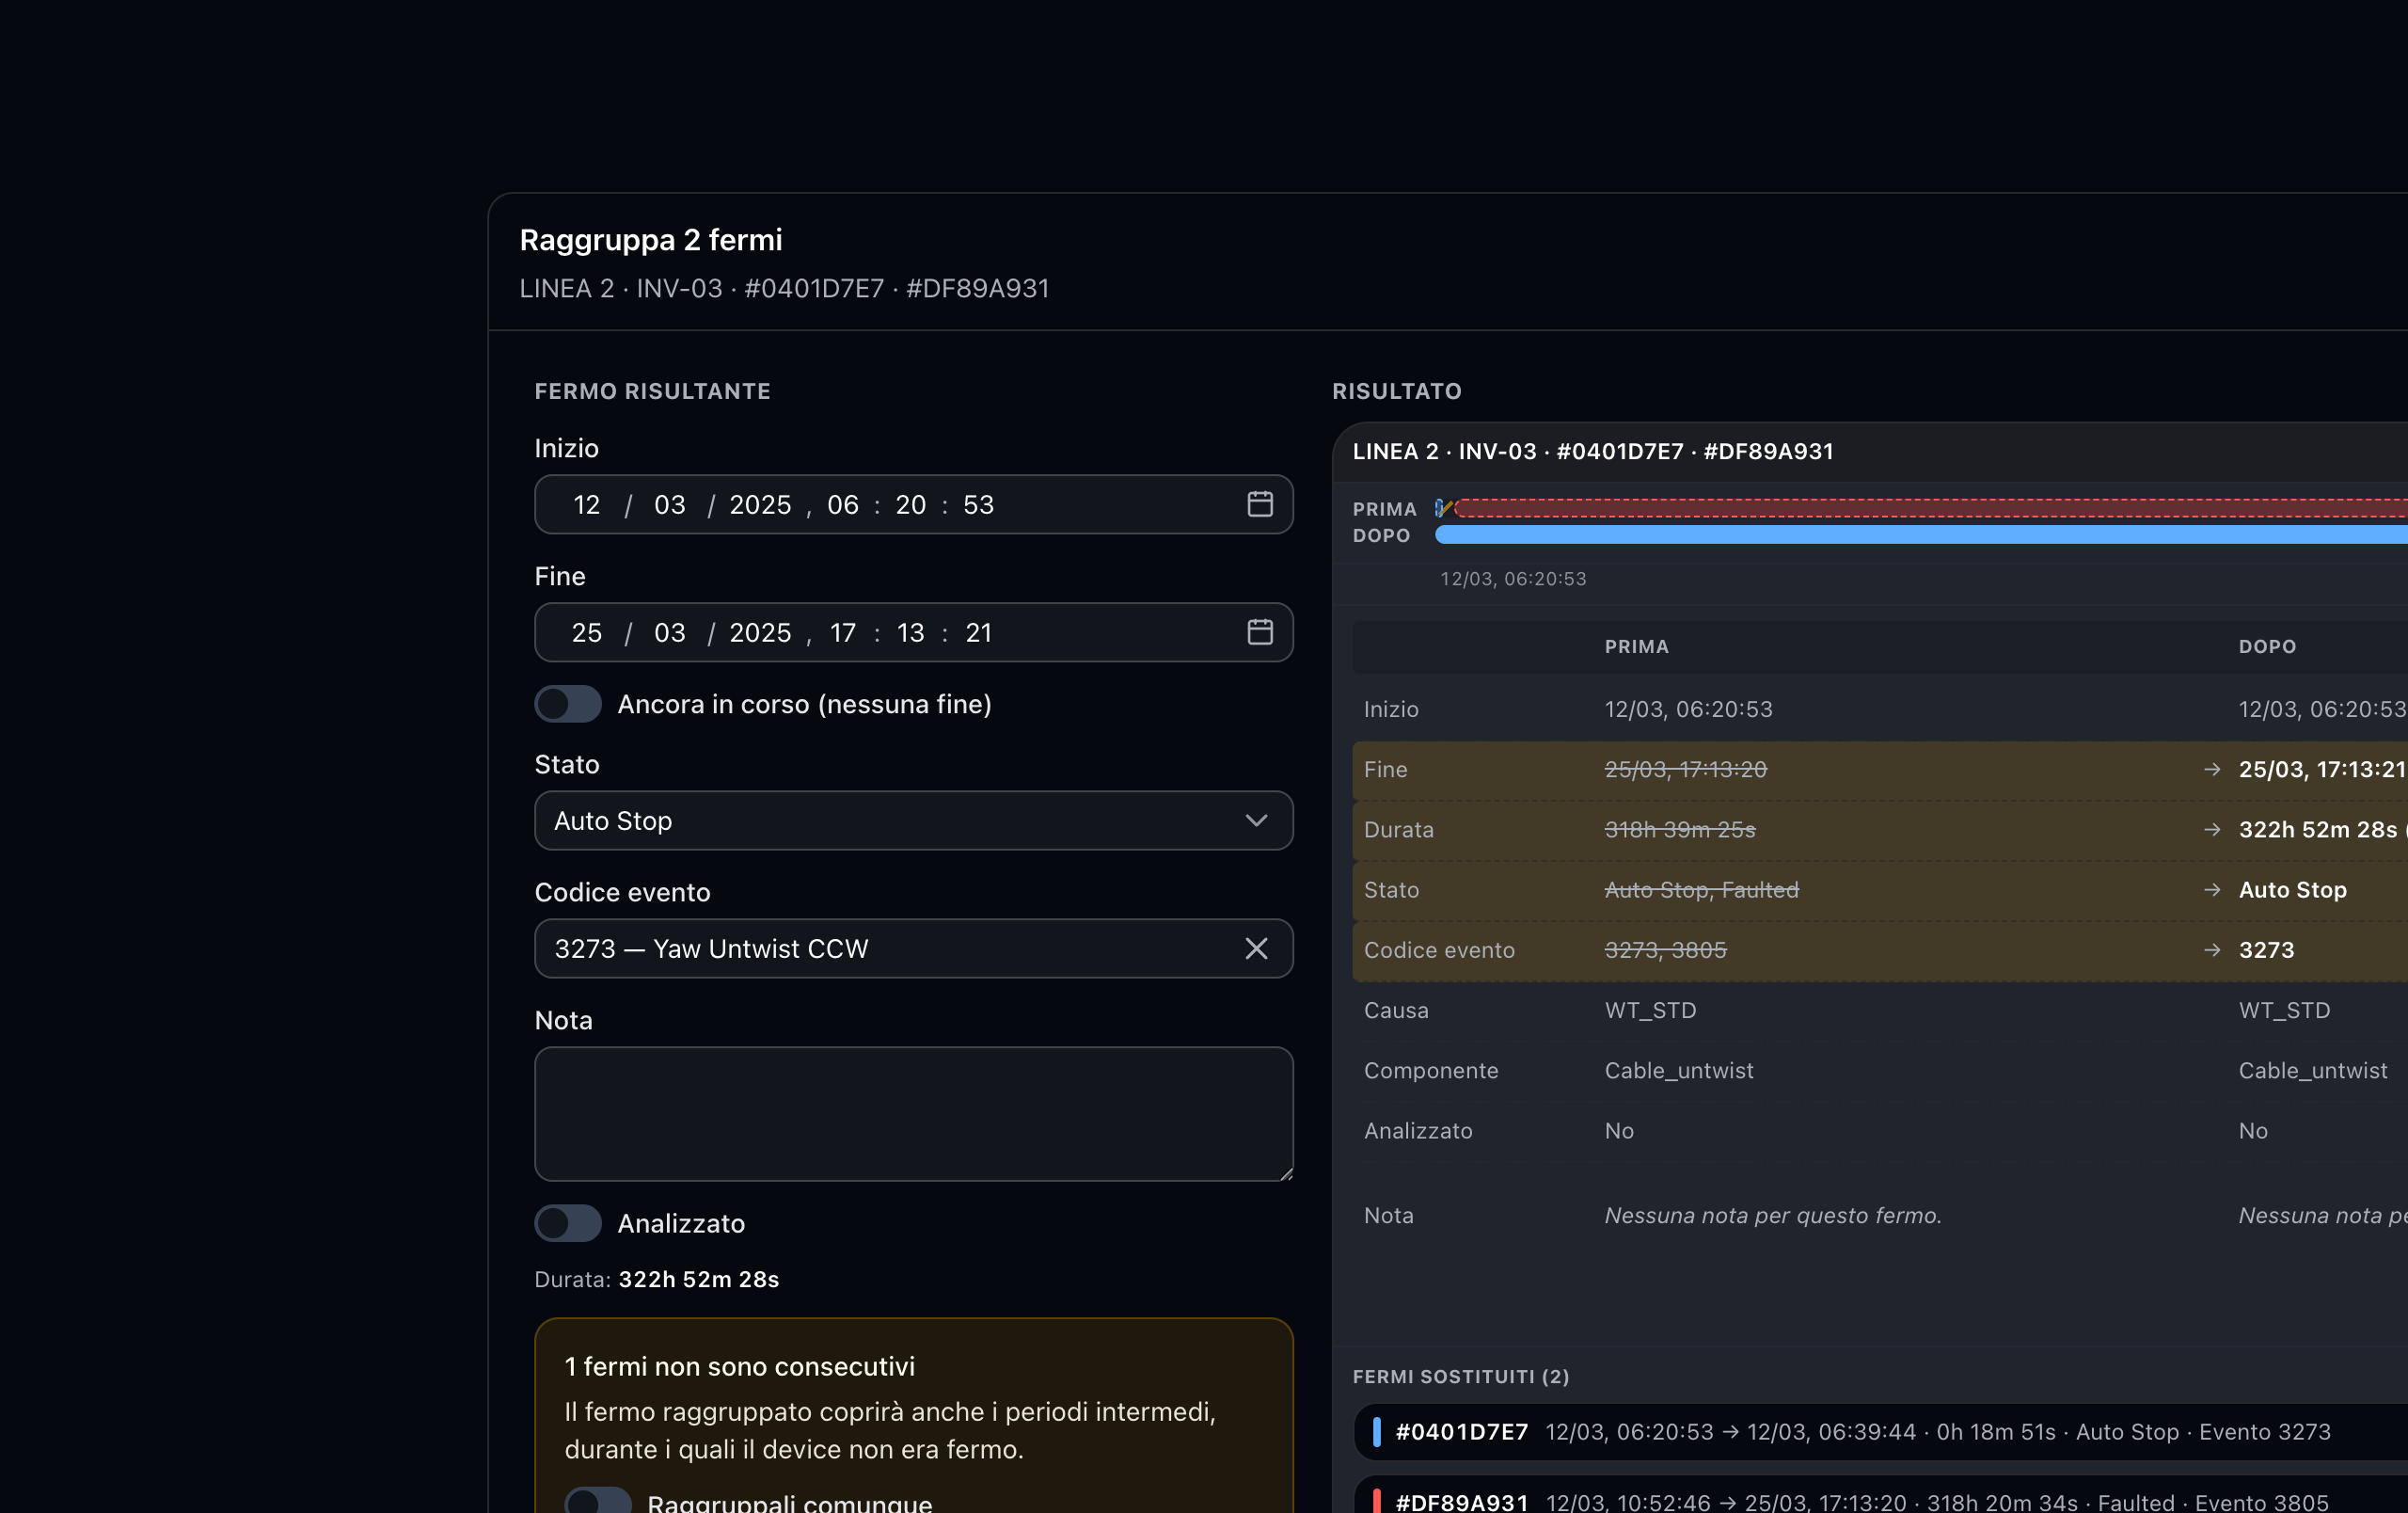
| Group | Selection on the same device, key G | Merges several downtimes into one. If there are gaps between them, they must be confirmed explicitly. |
| Analysed | Detail, menu, key A | Marks that an operator has checked the downtime. |
| Delete | Menu, key Backspace | Removes the selected downtimes, after confirmation. |
Downtime detail
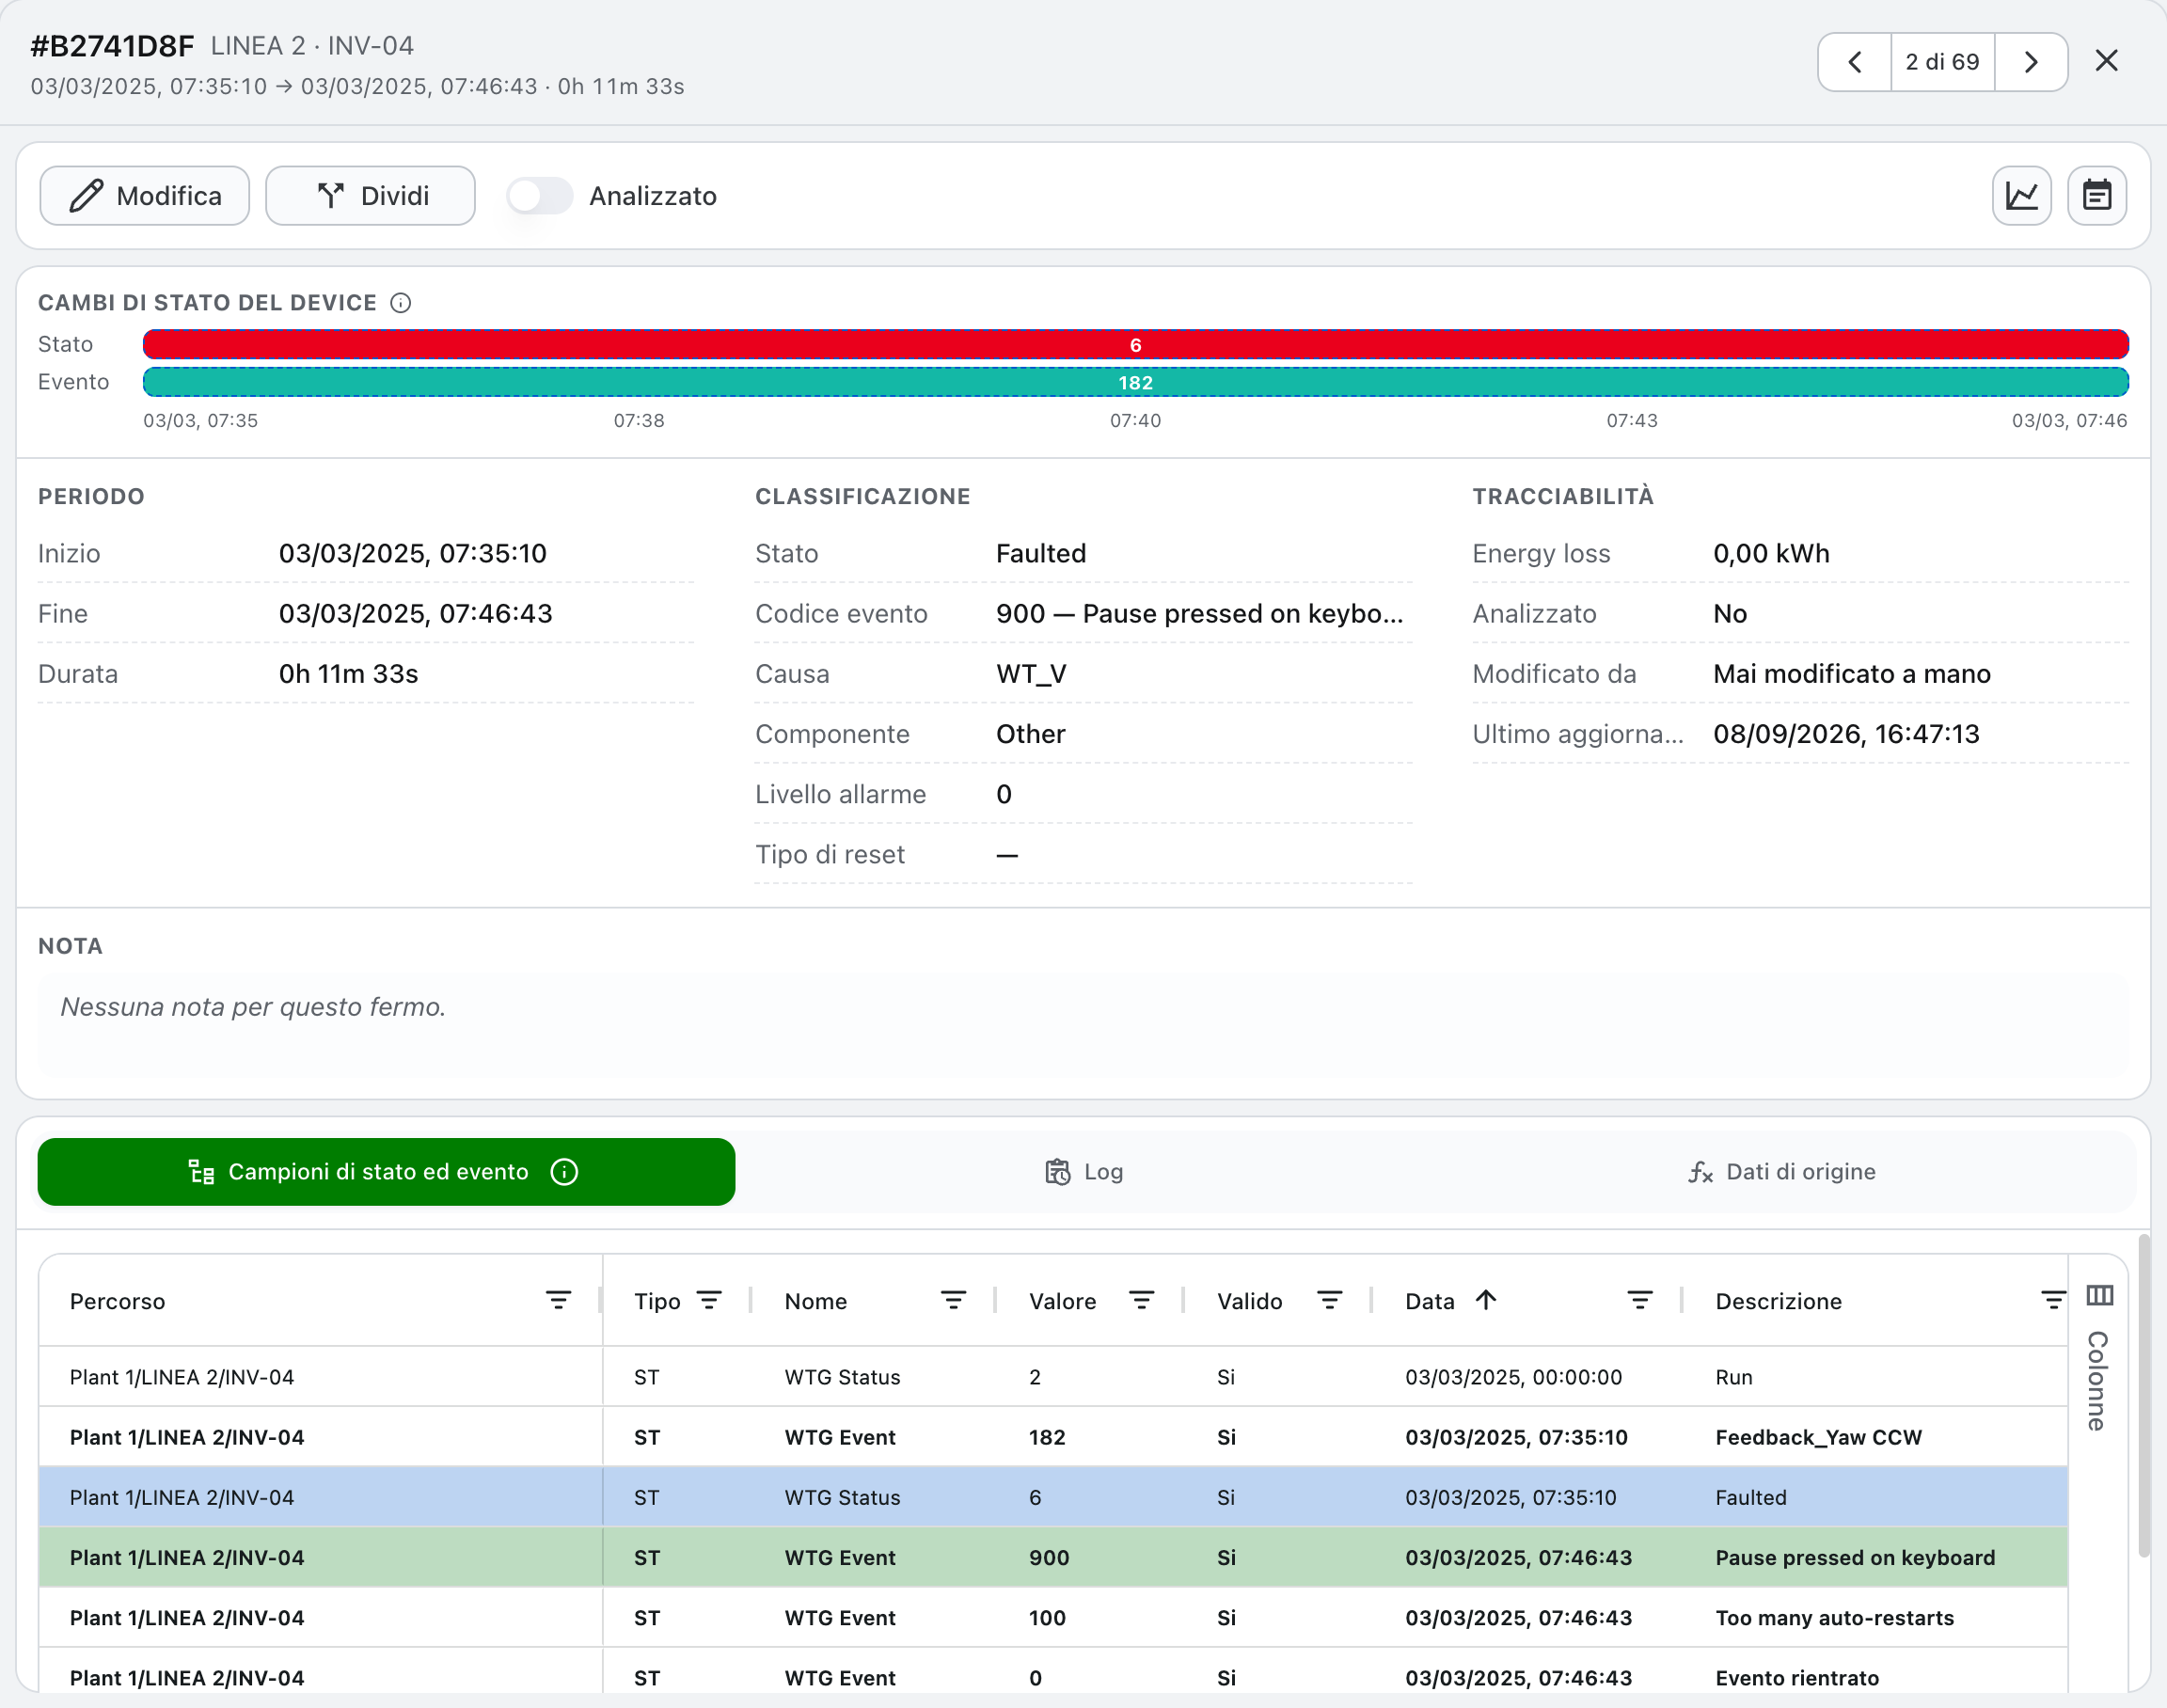
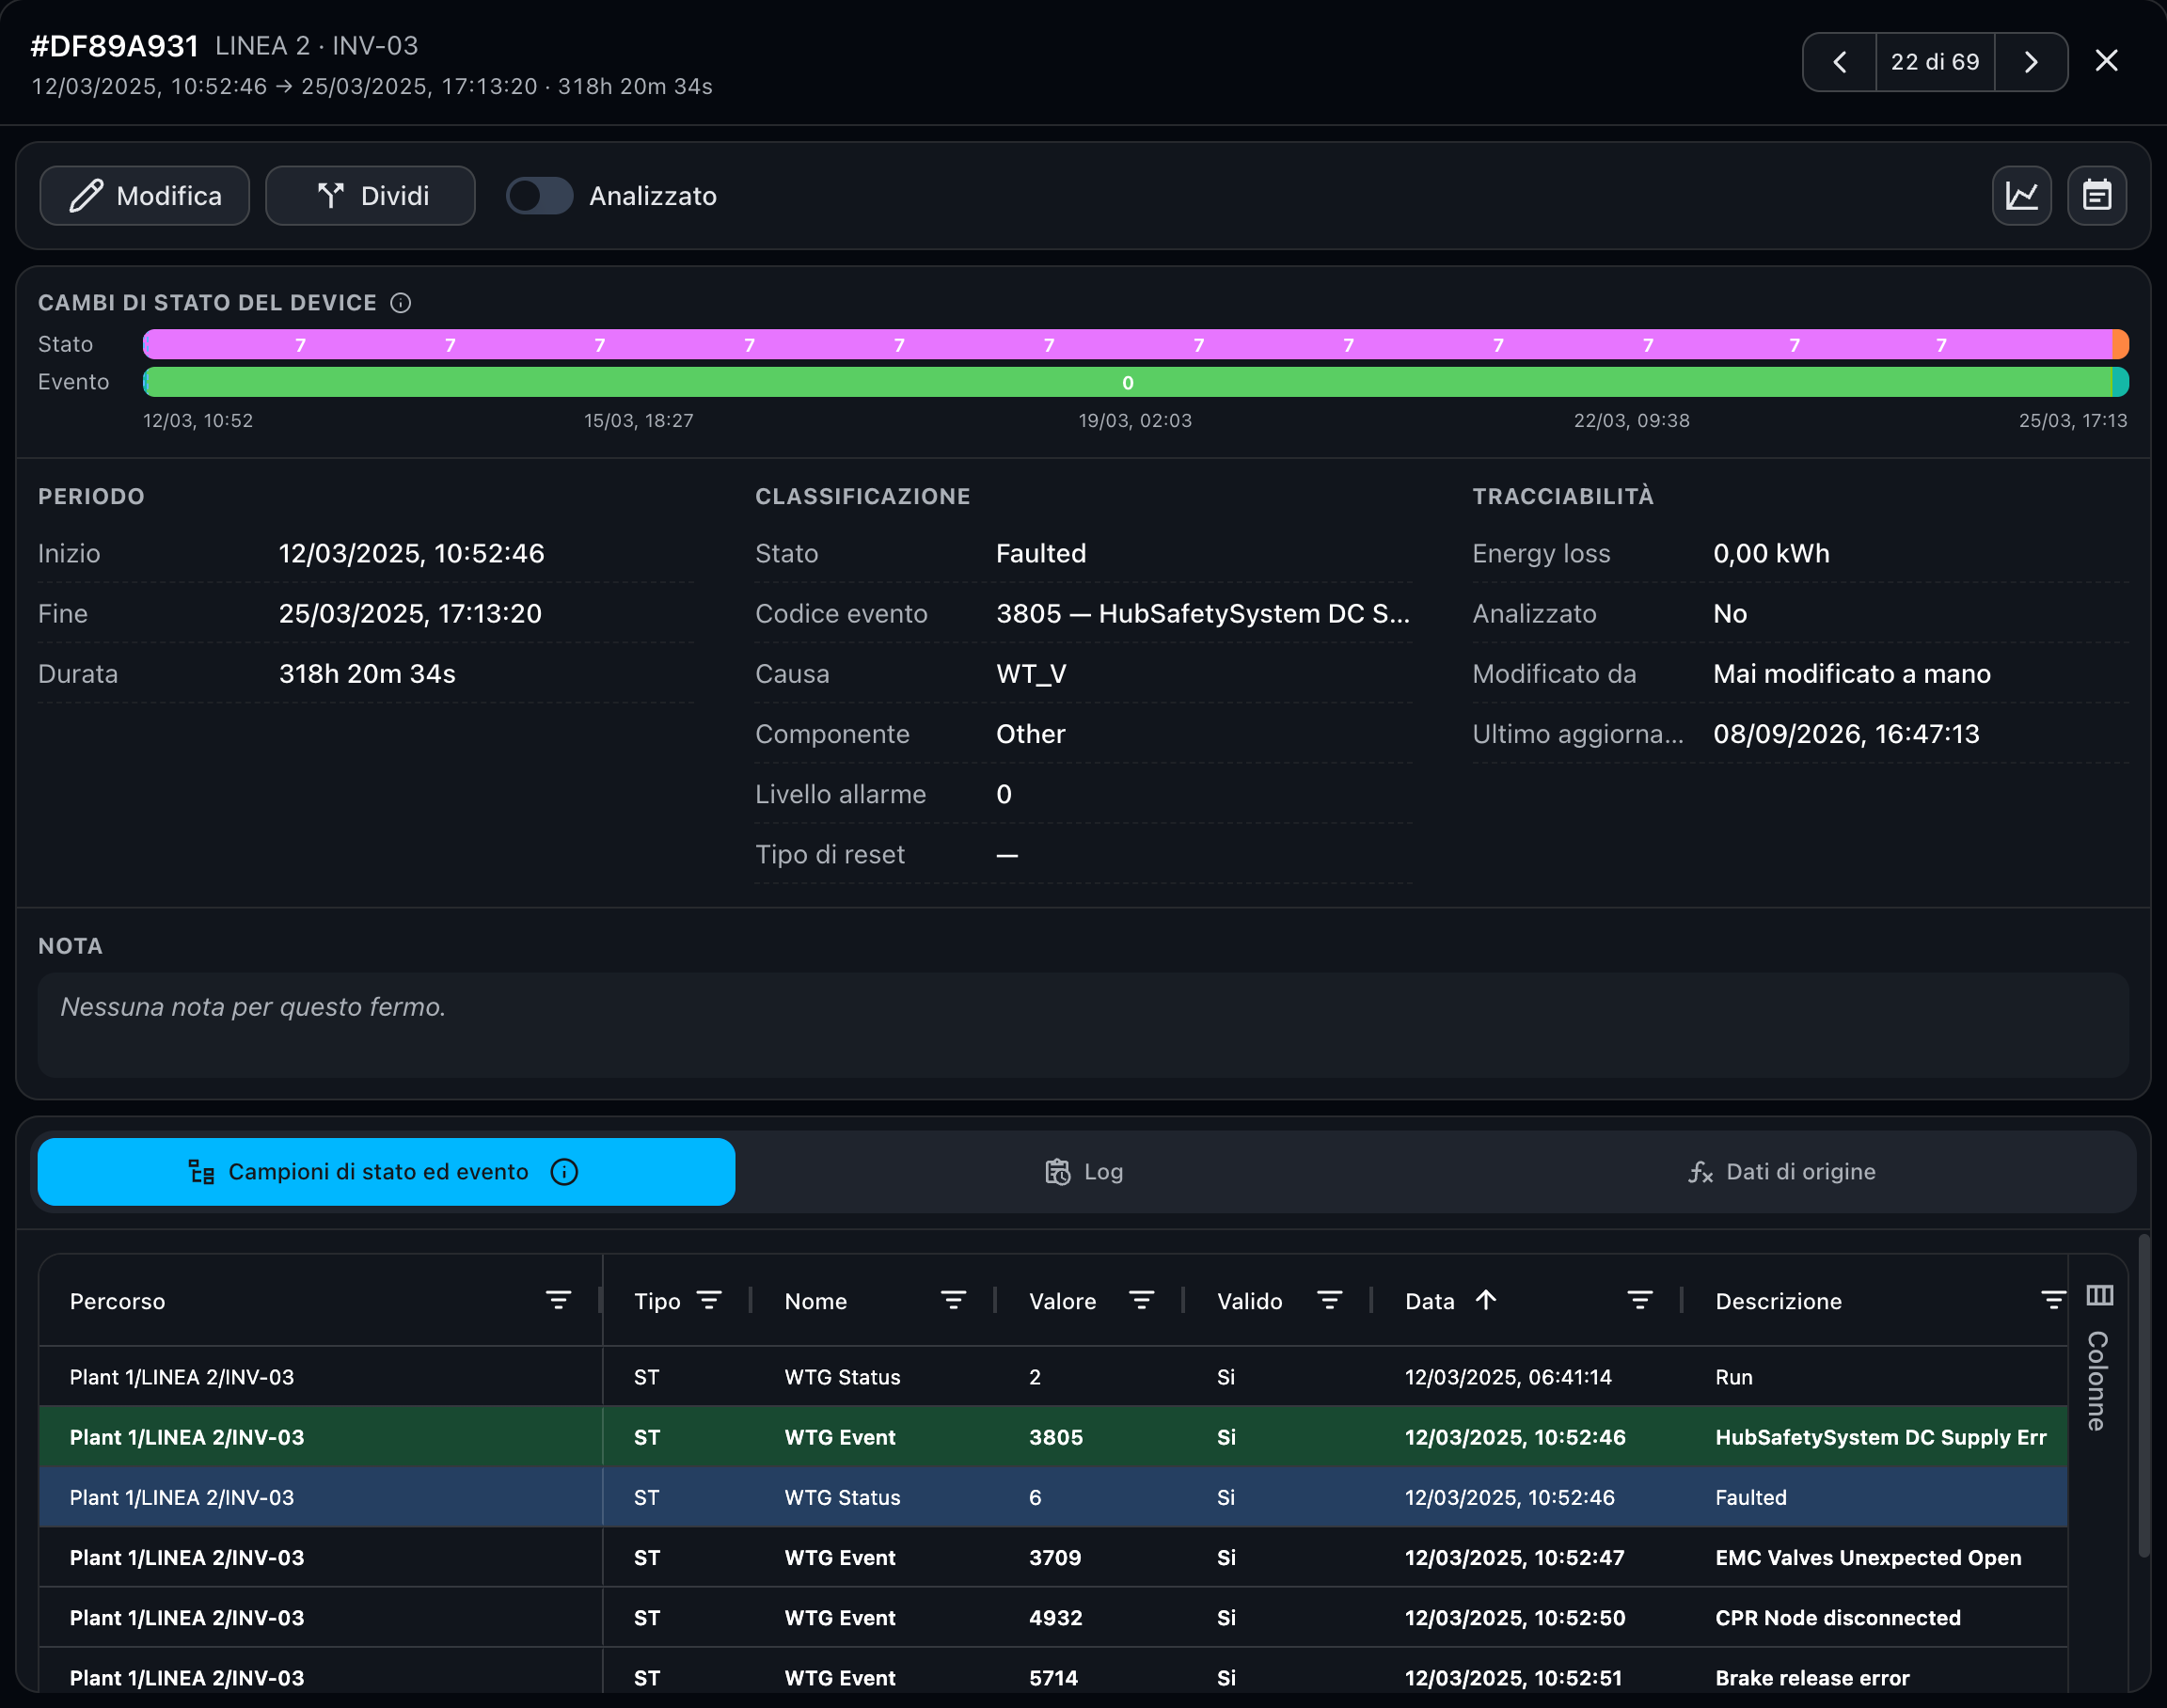
Opens with a double-click on a row or a bar, or with Enter on the selection. The arrows at the top right move to the previous or next downtime among the filtered ones.
- Card — period and duration, classification (state, event, cause, component), traceability (energy loss, analysed, edited by) and note.
- Samples read — the state and event samples read from the device in the period, with the matched event row highlighted and the average powers of the period.
- Origin data — where the downtime comes from: the window in which the recompute looks for the event and the share of energy lost against the producible one.
- Log — who changed what and when, with the Before / After state of every change; splits and groups show the downtimes involved.
The Trend and Events buttons open the other analysis pages with device and period already set.
Import: recompute with preview
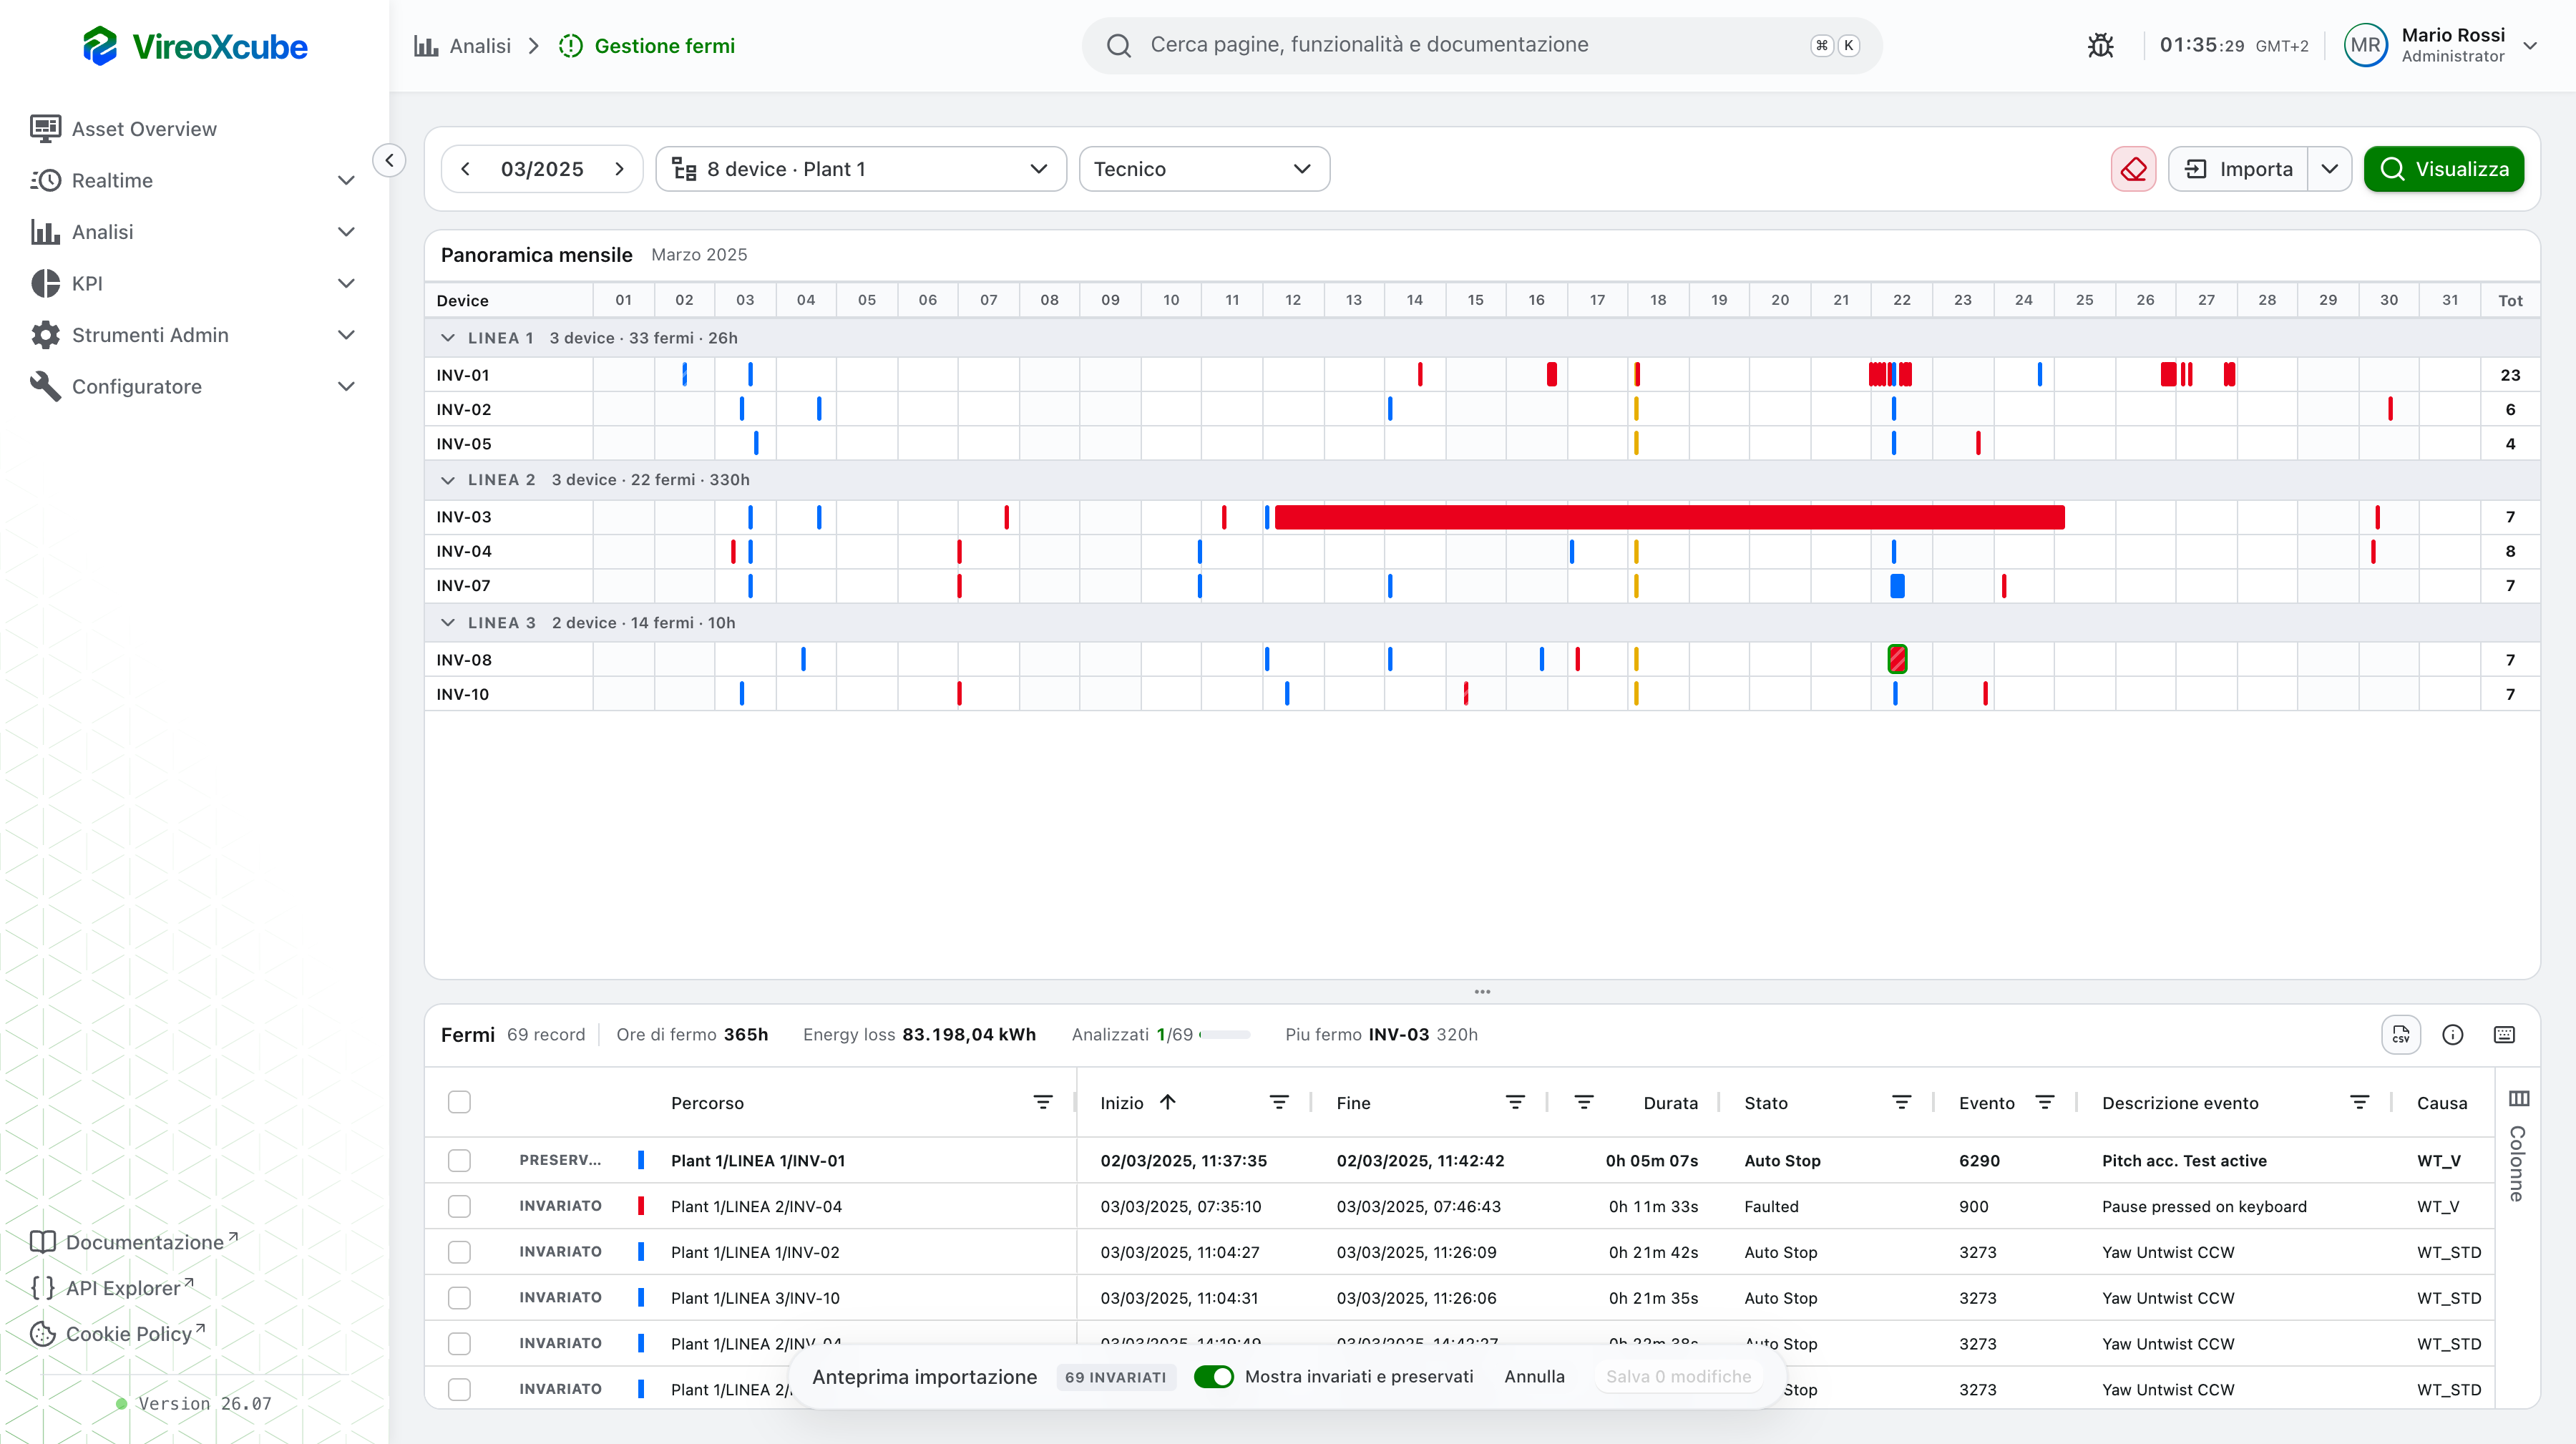
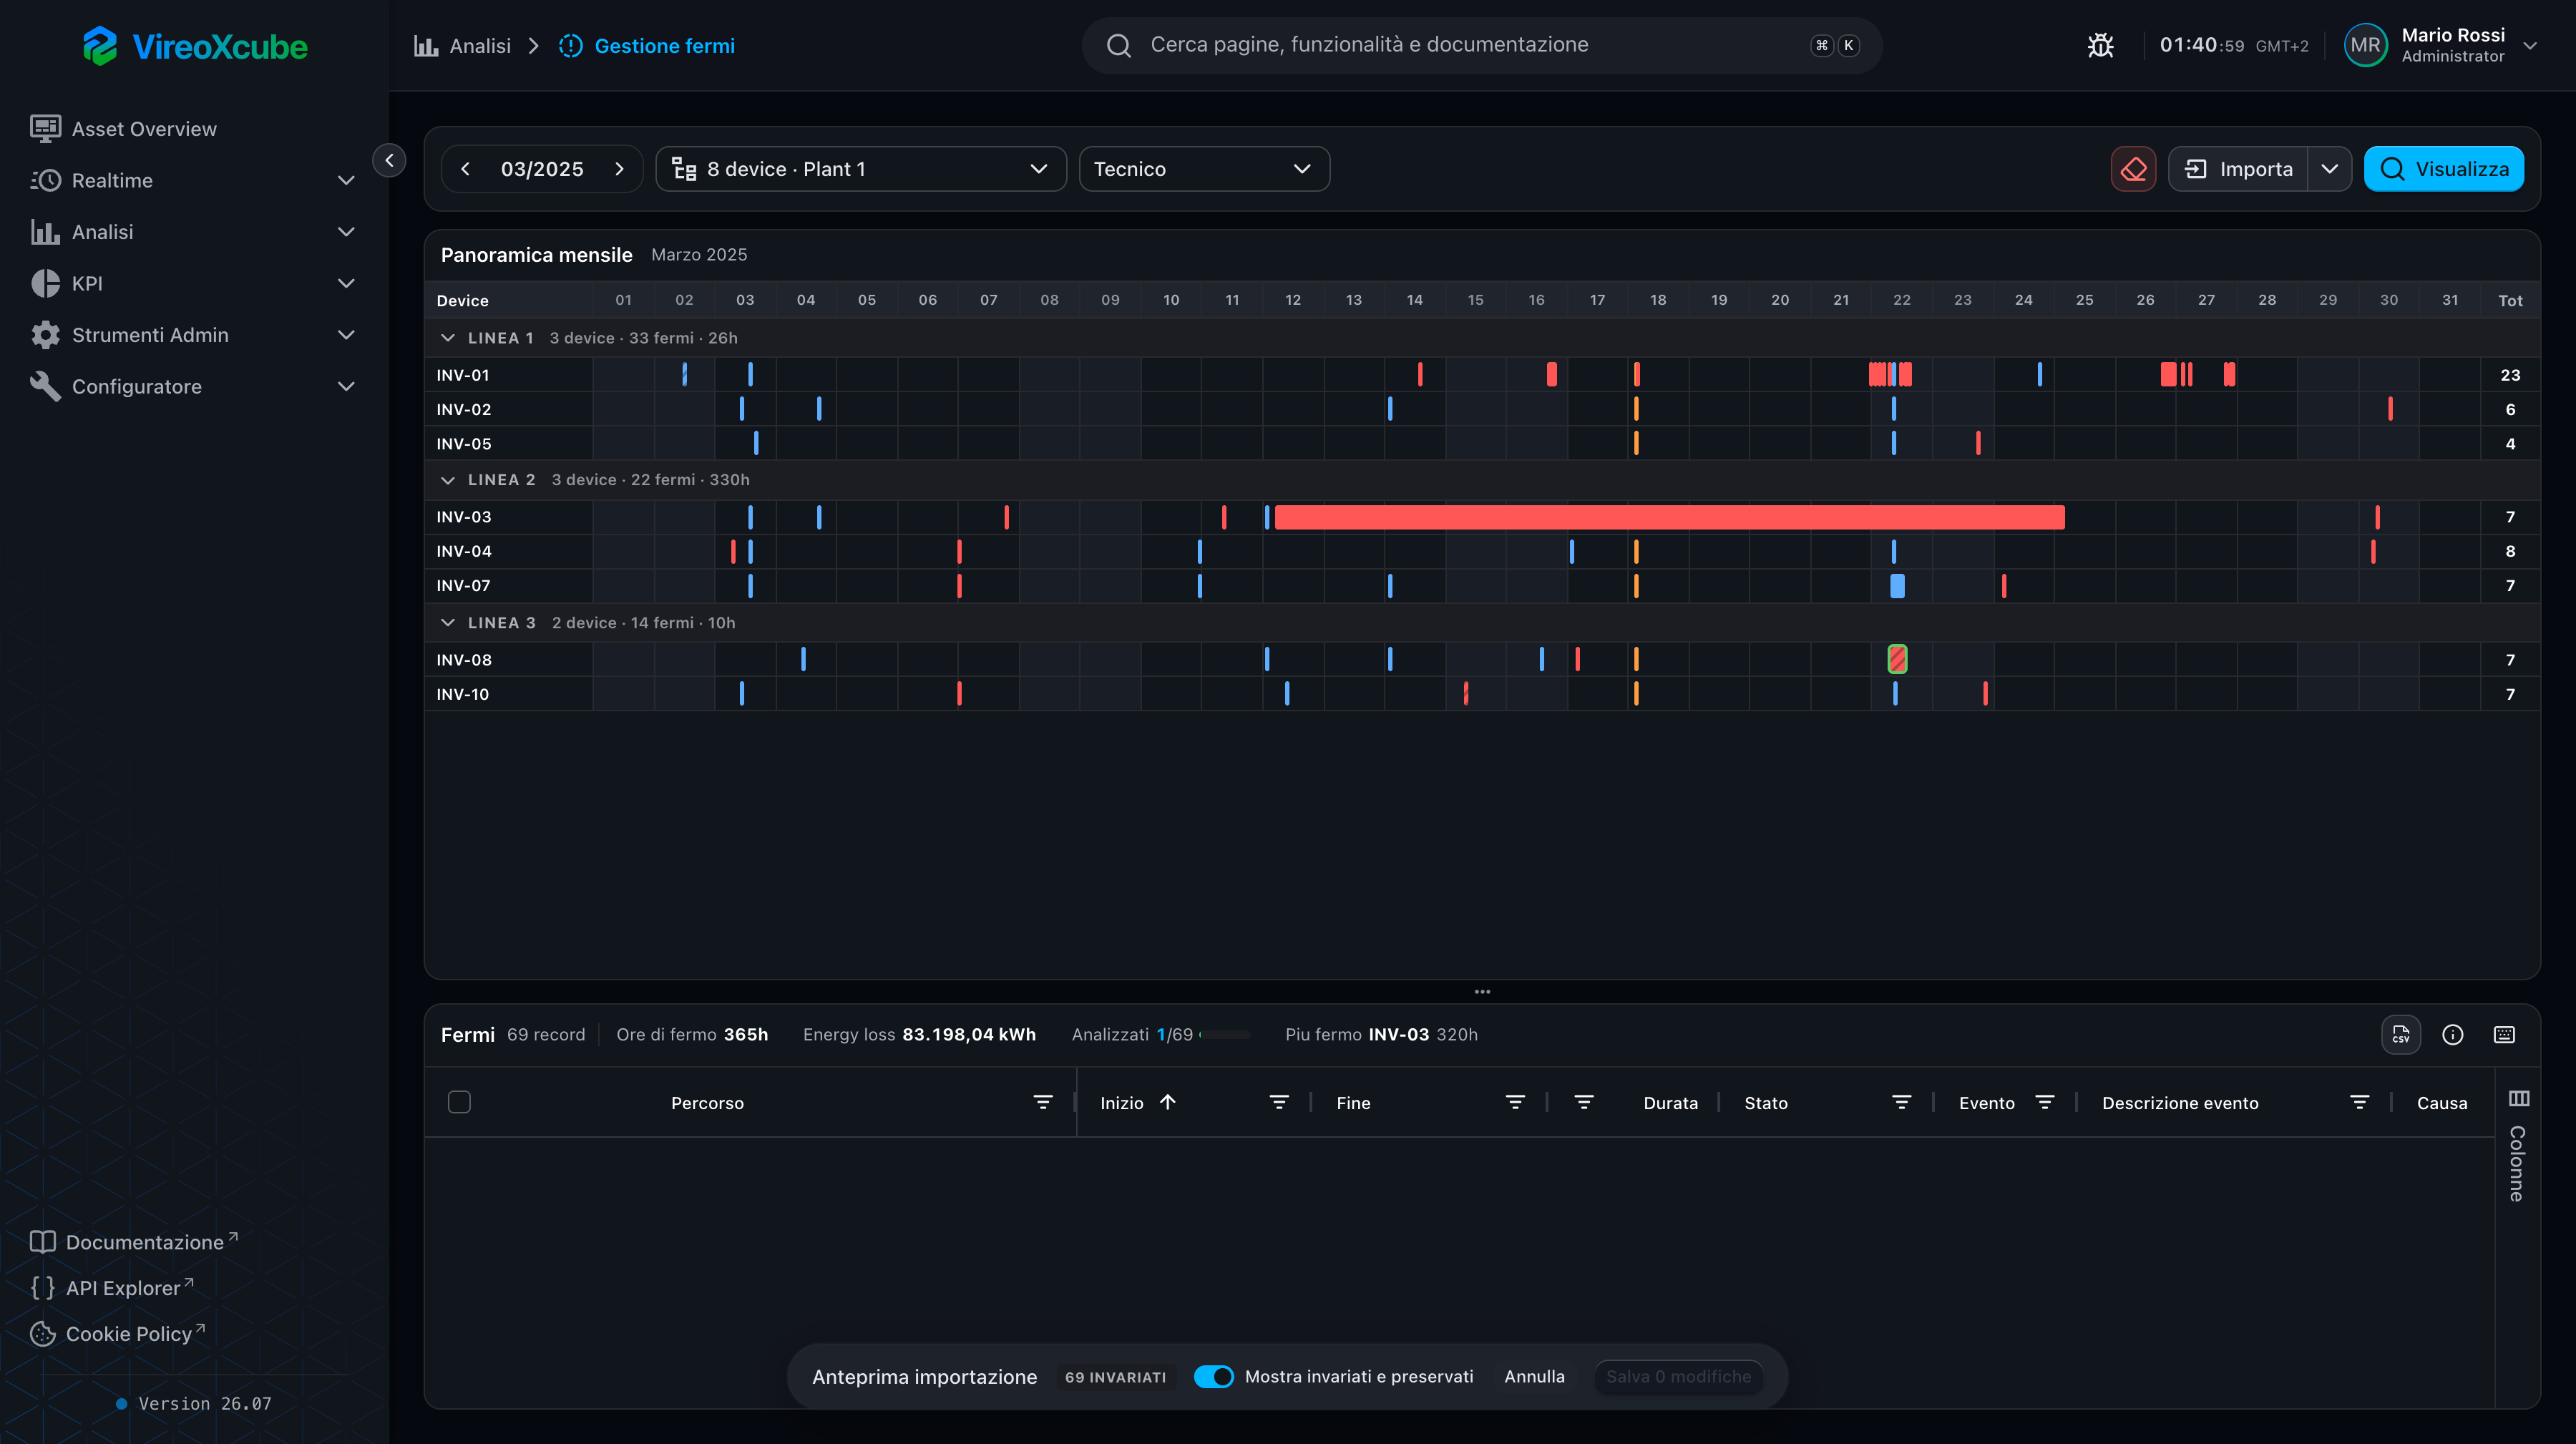
Import recomputes the month's downtimes from the data of the selected devices. While it runs, a banner at the bottom shows the progress and lets you cancel. When it ends, calendar and table show the result as a preview:
- New in green, changed in orange, removed hatched, from a split in blue.
- Hand-edited downtimes are protected: the recompute does not touch them.
- The Show unchanged and preserved switch dims or shows the downtimes that do not change.
Nothing is written until you press Save. If you change month or devices with a preview open, the page asks whether to save, discard or stay.
Keyboard shortcuts
| Keys | Action |
|---|---|
| ↑ ↓, Shift + ↑ ↓, Ctrl/Cmd + A | Move, extend, select all |
| Enter | Detail of the selected row |
| Esc | Clear selection and filters |
| E, S, G, A | Edit, split, group, analysed |
| Backspace | Delete the selection, with confirmation |
| N, I, R | New downtime, import, reload |
| T, V | Open in Trend, open in Events |
| Alt + ← → | Previous and next month |
| Ctrl/Cmd + C | Copy the selected rows to the clipboard |
| ? | Full list of shortcuts |
Shortcuts are off while a dialog is open or while you type in a field.
Frequently asked questions
Why can't I group the selected downtimes?
Grouping only works for downtimes of the same device. If there are gaps between them, the dialog asks you to confirm.
Why doesn't the energy loss appear in the preview?
The server computes it from device data after saving: a value shown before would be an estimate, not the real figure.
What happens to the downtimes I fixed by hand when I recompute?
They stay as they are: the recompute recognises them from the «edited by hand» marker and does not replace them.