
Data completeness
The Data completeness page measures the quality and availability of the data acquired by the system for a plant over a selected month, broken down per device and rolled up per plant. It is intended for operators and is available for wind and photovoltaic plants.
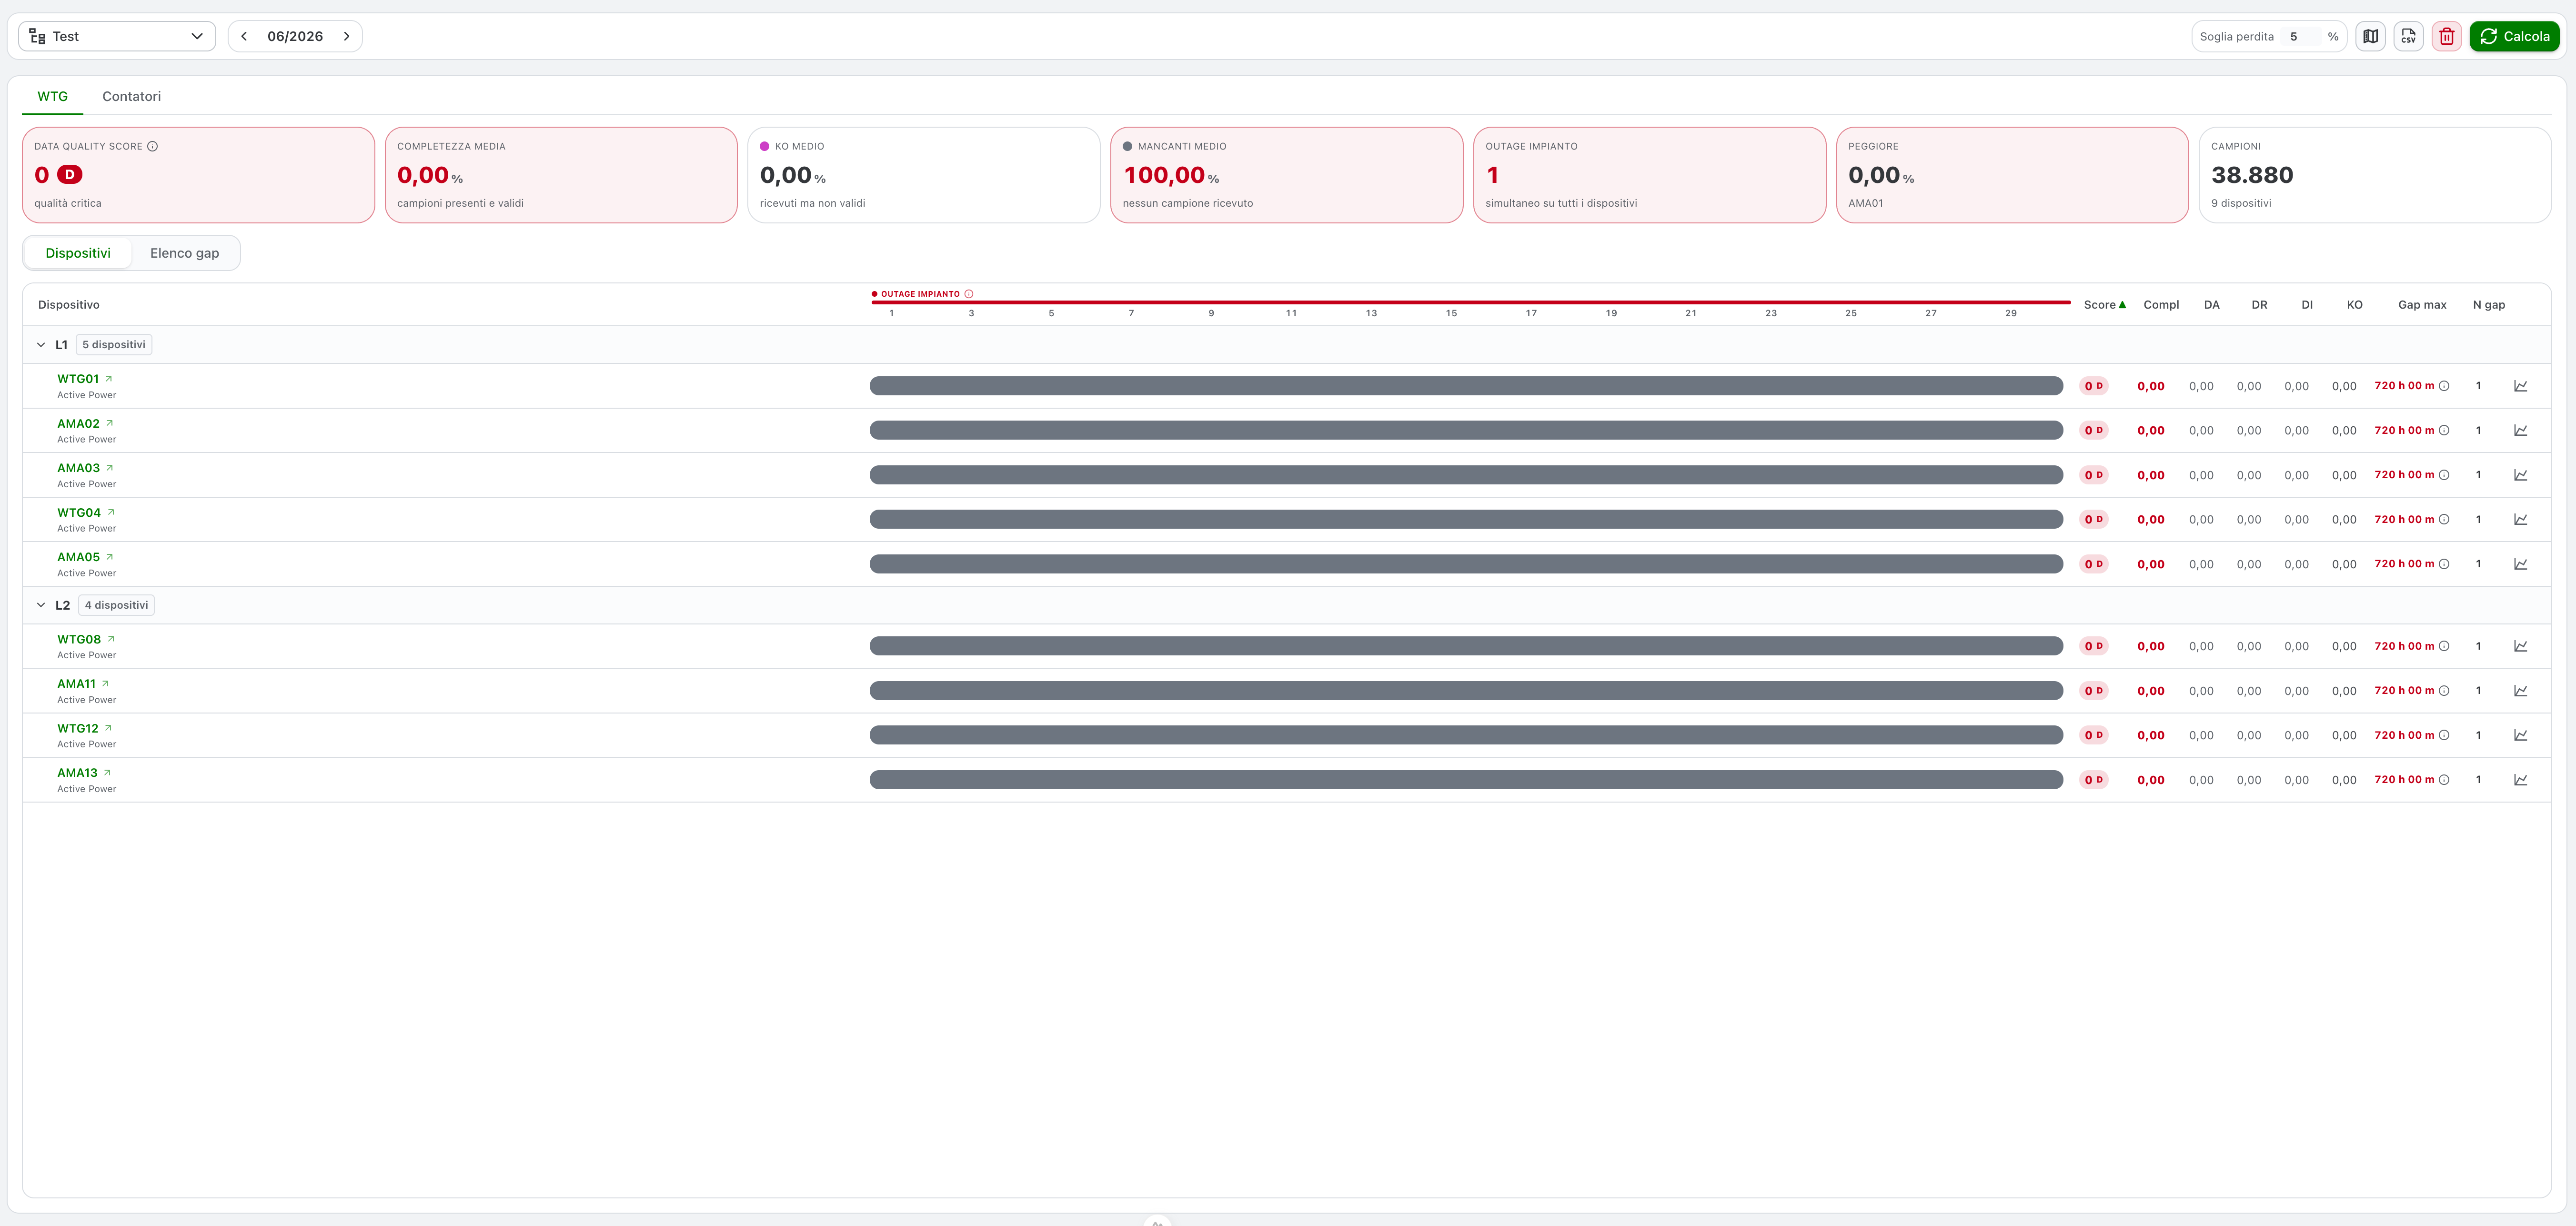
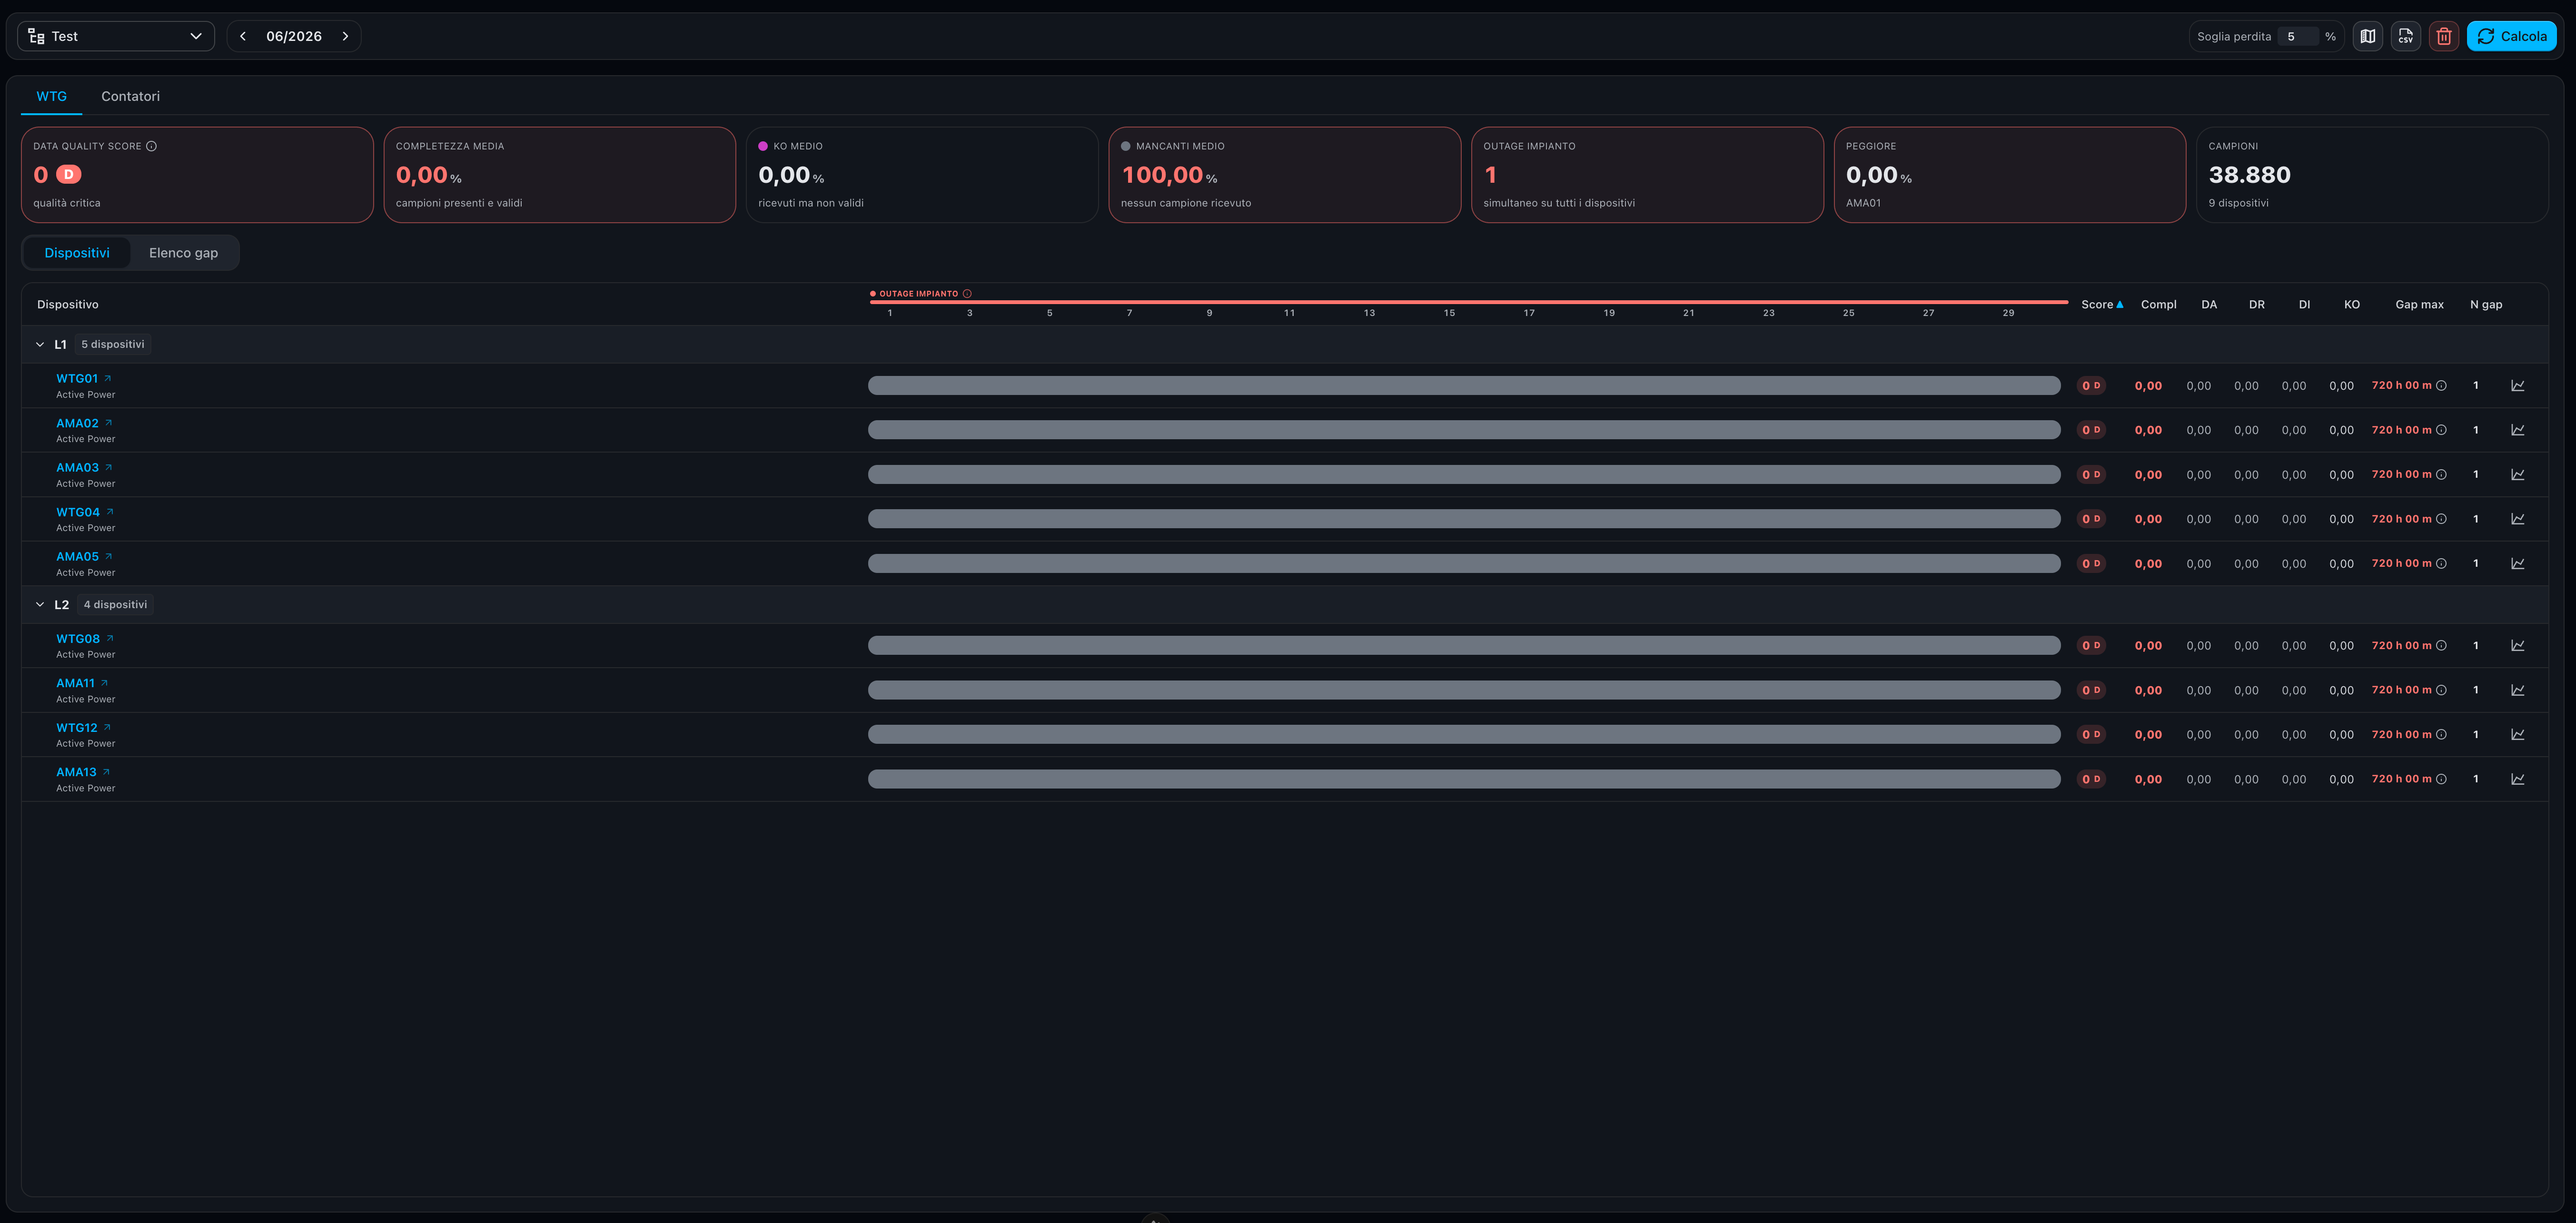
How a calculation works
The page follows three states:
- Quick start — on first open, a short guide explains the steps. The toolbar is already active.
- Loading — after pressing Calculate, the analysis runs on the server for all device families at once and streams results back: the grid fills up progressively as devices arrive, with a progress banner you can cancel at any time. Views with no data yet show a skeleton, and you can switch view while loading.
- Ready — the KPI strip, the view switch and the grid are complete (plant score and outages arrive at the end of the stream).
For each device, the system builds the expected samples of the month (based on the device time base: 10 minutes for wind turbines, 15 minutes for counters and PV sensors/inverters) and classifies every expected sample.
Page flow
- Quick start — on first open, a short illustrated guide explains the main steps (select plant, choose month, click Calculate, review results). The toolbar is ready to use.
- Select plant and month — pick a plant from the tree and set the analysis month. The plant type (wind or solar) determines which device families are available.
- Set loss threshold (optional) — adjust the completeness threshold to highlight data below a certain quality level (default 5%).
- Click Calculate — the analysis runs server-side and streams results back. A progress ring appears on the button and fills as devices are processed. Views (tabs) remain active during loading, and you can switch between them to see partial results as they arrive.
- Review KPI strip — once the first device results arrive, the plant roll-up appears (data quality score, average completeness, KO, missing, FR, outages, samples).
- Review device grid — the grid fills with one row per device, showing score, completeness, longest gap, bar of the month by day, and staleness badge (current month only).
- Switch views — tab selector above the KPI strip lets you change device families (WTG/Counters for wind; Sensors/Inverters/Counters for solar) without recalculating.
- Switch to gaps — toggle below the KPI strip switches between Devices (grid) and Gap list (all gaps, sortable/filterable by device and type).
- Drill down — click a day bar segment in a device row to see hourly detail for that day; click a device name to see the carpet plot (heatmap of hourly loss over the month) and main gaps.
- Export CSV — button exports the current grid as a spreadsheet (score, completeness, per-status percentages, gap stats).
Toolbar
| Control | Description |
|---|---|
| Plant | Pick the plant to analyse from the tree. The button icon reflects the plant type (wind or solar). |
| Month | Editable field plus a month-only calendar with year navigation and ‹ › arrows. The month/year order follows your date-format preference. |
| Loss threshold | Default 5%. Completeness, KO, FR and missing cells turn red above this loss threshold. |
| Legend | Explains the meaning of each status color. |
| Export CSV | Exports the current grid (per device: score, completeness and per-status percentages, longest gap, gap count, samples). |
| Reset | Clears everything and returns to the initial state. |
| Calculate | Runs the analysis. Shows a warning dot when plant or month changed since the last run. During the calculation, a progress ring fills to show how many devices have been processed. |
Device family tabs
After you select a plant and start calculating, a tab row appears above the KPI strip with the available device families:
- Wind: WTG (wind turbines) and Counters.
- Solar: Sensors (meteorological), Inverters and Counters.
All families are computed by a single Calculate: switching tabs is instant, even while loading. The active tab underline shows which view you are browsing.
Status model and legend
Every expected sample is classified, in priority order:
| Status | Meaning |
|---|---|
| DA | Normal system data, acquired regularly |
| DR | Data retrieving — recovered afterwards by the retrieving routines |
| DI | Data import — imported manually by an operator |
| KO | Invalid — received but rejected by quality control |
| FR | Frozen — value unchanged for over an hour (sensors only) |
| MIS | Missing data — no sample received (gap / communication loss) |
| Night | Night, excluded from the total (inverters and PV sensors) — shown hatched |
| Future | Sample in the future — excluded from the total |
Completeness% = DA + DR + DI. Loss% = KO + FR + MIS, and drives the threshold and the alarm KPIs. Missing (MIS) is a status of its own — no sample was received — distinct from KO, where a sample arrived but was invalid.
Night exclusion
For inverters and PV sensors, nighttime samples are excluded from the total (denominator) and marked as Night, so the PV completeness already reflects daylight hours only. Daylight windows are computed from the device coordinates, falling back to the plant coordinates; if neither is configured, a default 06:00–18:00 UTC window is applied. Wind turbines and counters have no night exclusion.
KPI strip
The plant roll-up at the top shows:
- Data quality score — 0–100 with an A/B/C/D class. Hover the info icon to read how it is computed.
- Average completeness — DA + DR + DI, red below the threshold.
- Average KO and Average missing.
- Average FR — sensors only.
- Plant outage — number of simultaneous blackouts (see below).
- Devices offline (current month) or Worst device (past months).
- Samples — total counted samples, cadence and device count.
The data quality score starts at 100 and subtracts weighted penalties: missing × 1.0, KO × 0.8, FR × 0.5, plus a penalty for the longest gap. Classes: A ≥ 90, B ≥ 75, C ≥ 60, D below.
Devices view
A switch lets you choose between Devices (the grid) and the Gap list.
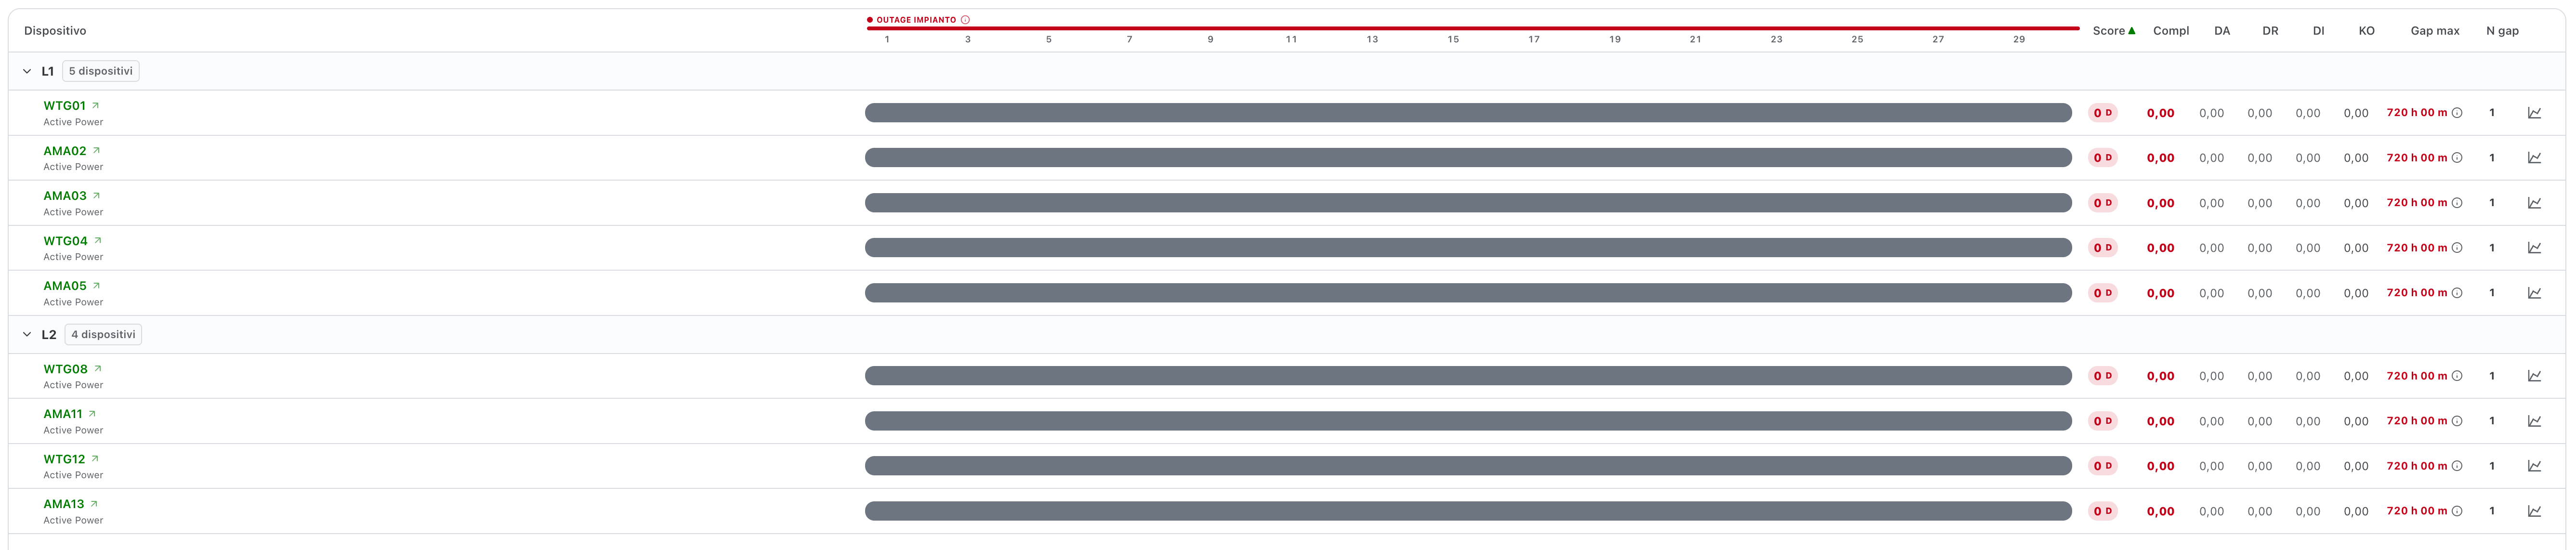
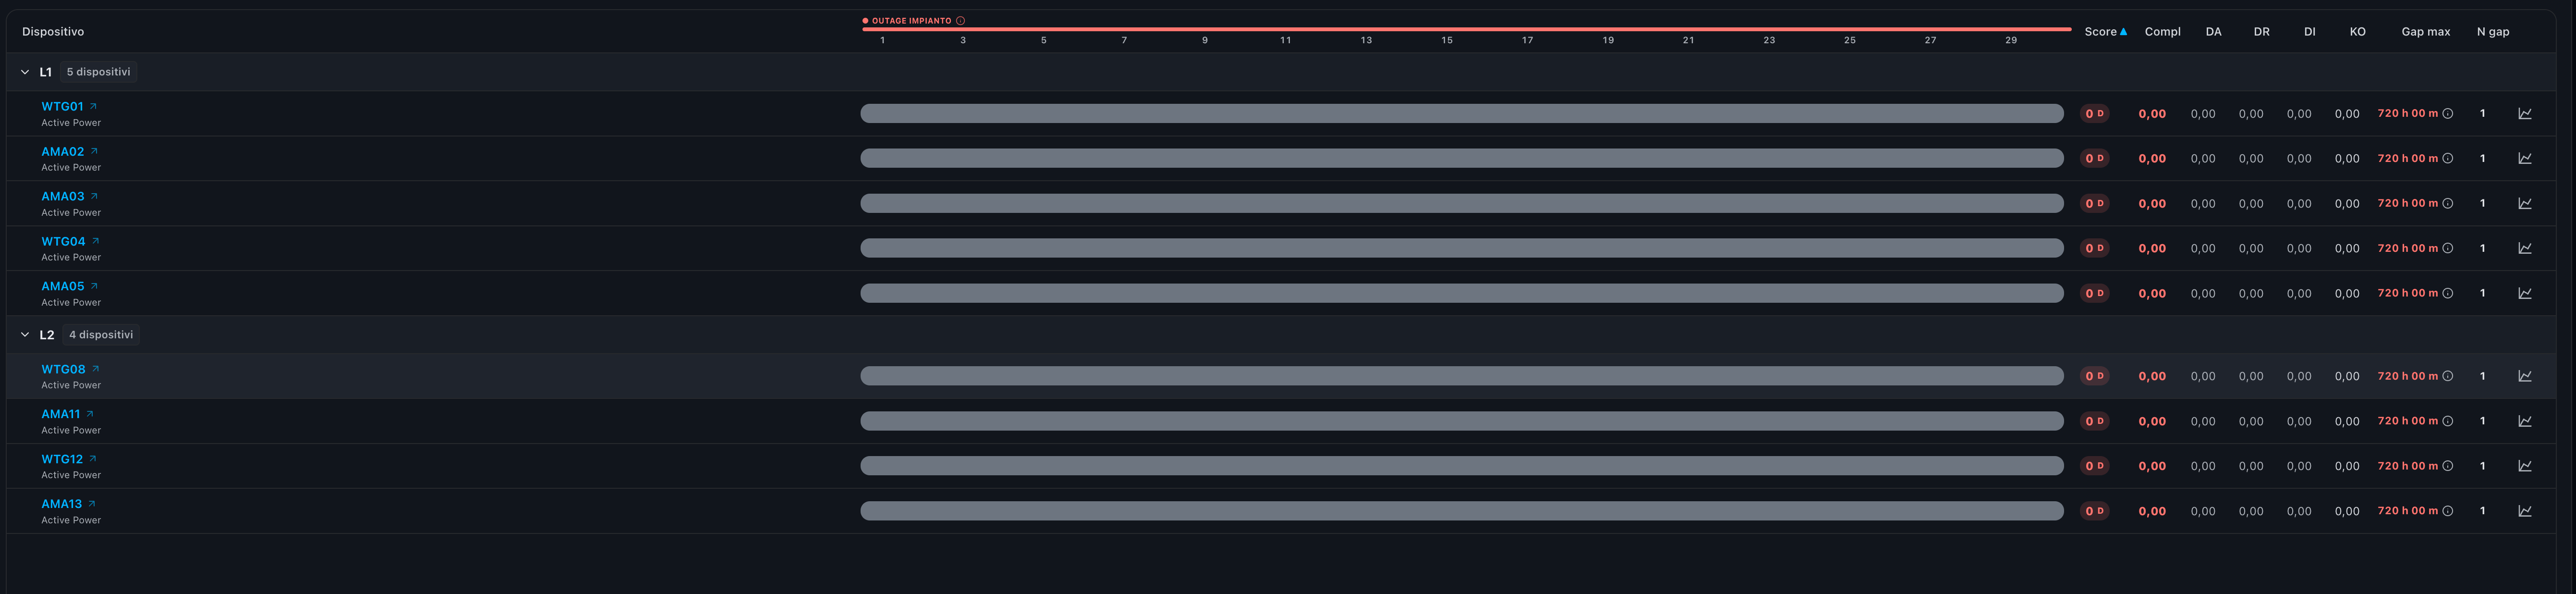
Each row shows:
- Device — type icon, name (a link to the device detail) and, in the current month, a staleness badge (live / slow / offline).
- Bar — a continuous, run-length bar of the month. Hover a segment for a tooltip (status, interval, samples). Click a day to open the day detail. PV night intervals are hatched.
- Score, Completeness, DA / DR / DI / KO (and FR for sensors).
- Gap max (longest gap and its day) and N gap (number of gaps).
- Open in Trend — opens the device signals in the Trend page.
Columns are sortable (click the header); the default sort is by Score ascending, so the worst devices appear first. Sections are collapsible.
Plant outage vs device fault
When every device is missing at the same instant, the system reports a plant outage — a logger or communications blackout, distinct from a single device fault. Outages appear as a flat red ribbon above the day axis, as a KPI, and as a dedicated tag in the gap list.
Gap list
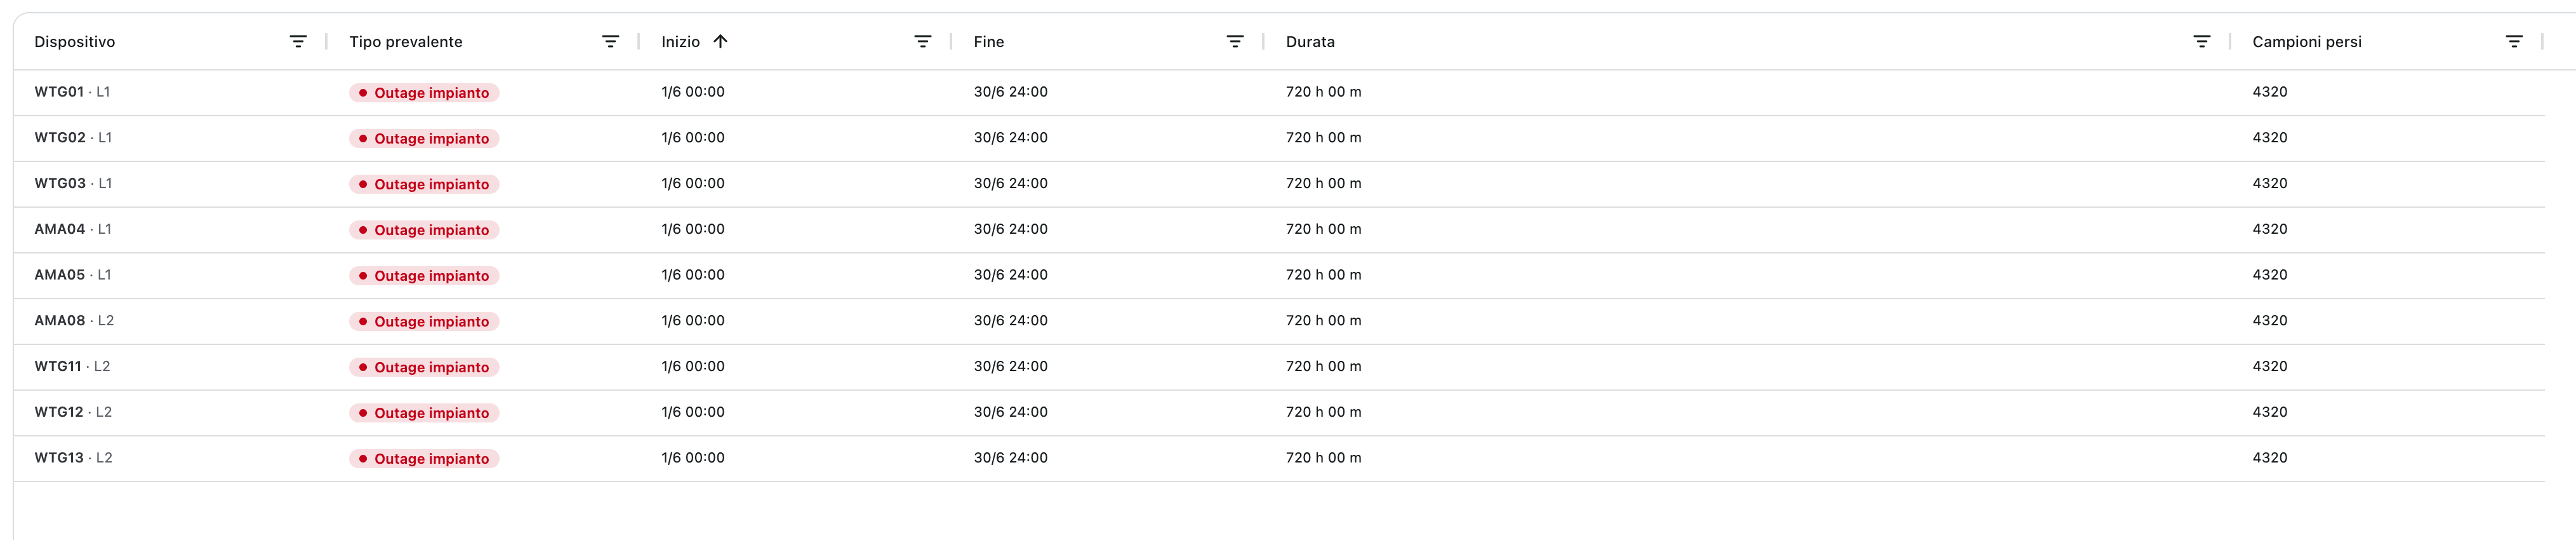
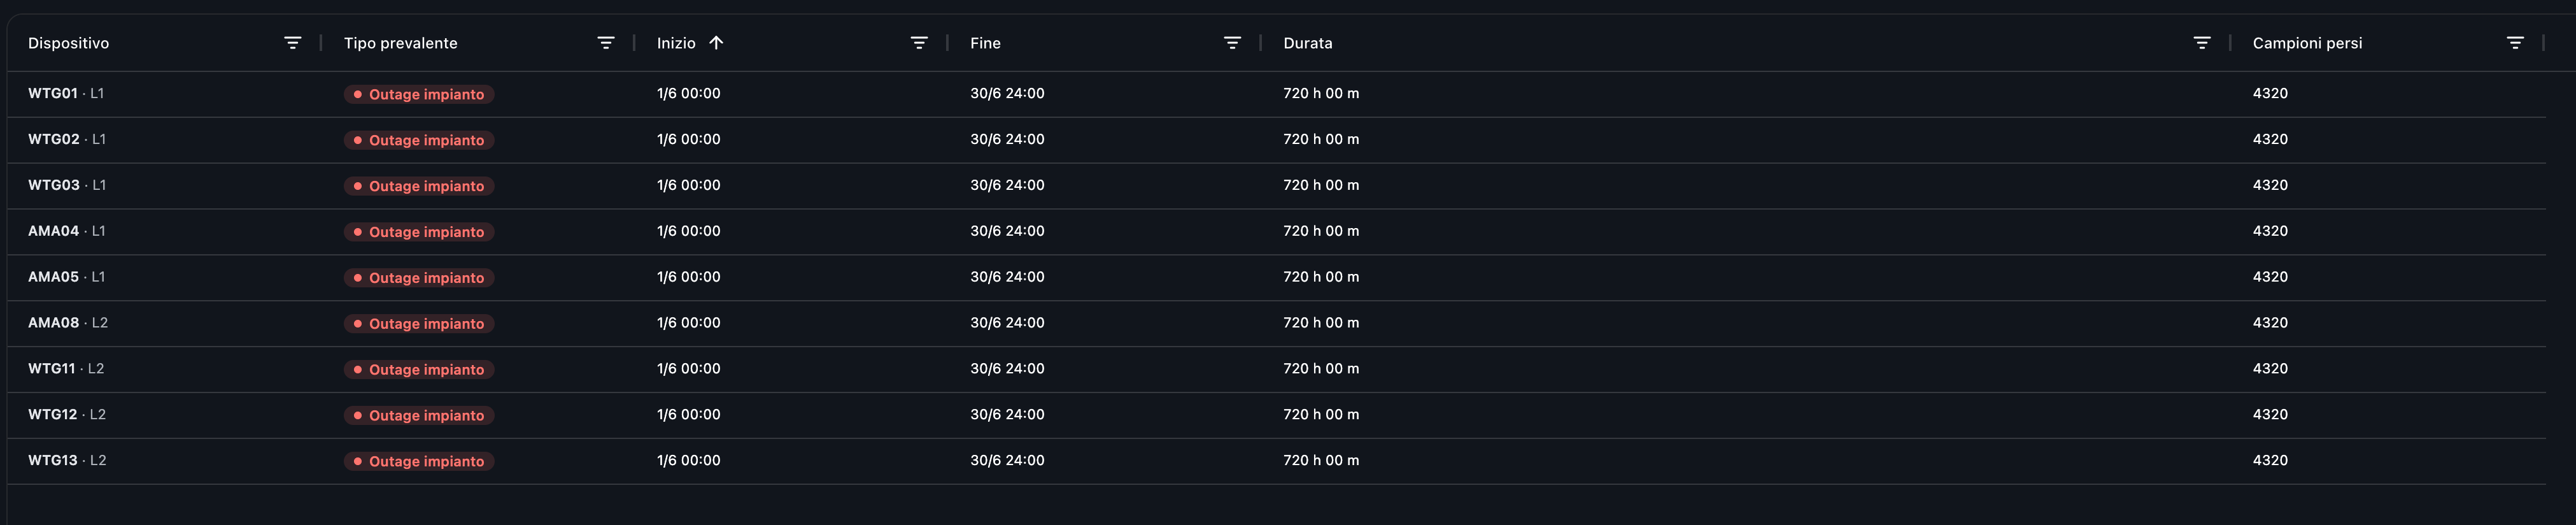
The Gap list is a sortable, filterable table of every gap. Columns: Device, Prevalent type, Start, End, Duration, Lost samples. Click the funnel icon in a header to filter (text contains, or a value list on the prevalent type). The prevalent type is tagged as Missing data, Invalid, Frozen or Plant outage.
Day detail
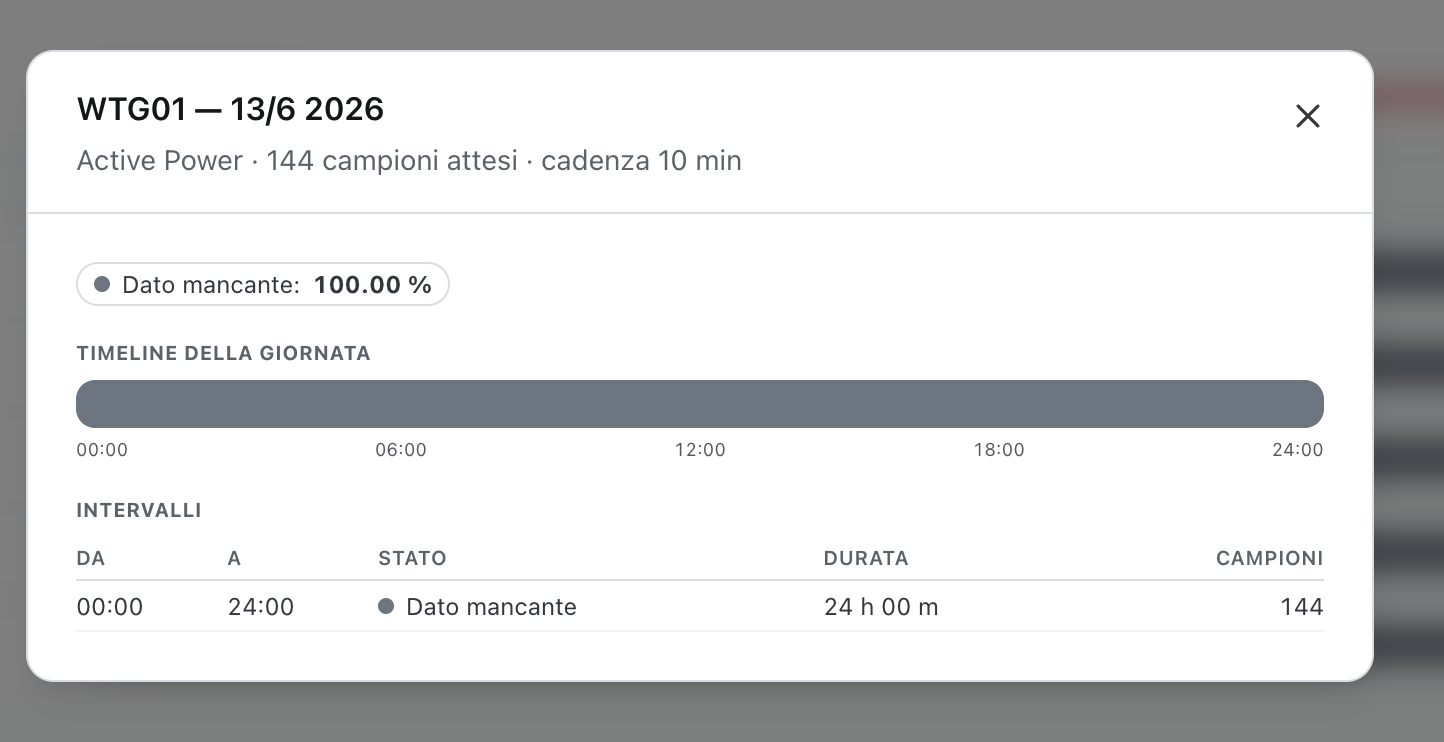
Clicking a day in a device bar opens the day detail: summary chips per status, a 00–24 timeline, and a table of intervals (From / To / State / Duration / Samples).
Device detail
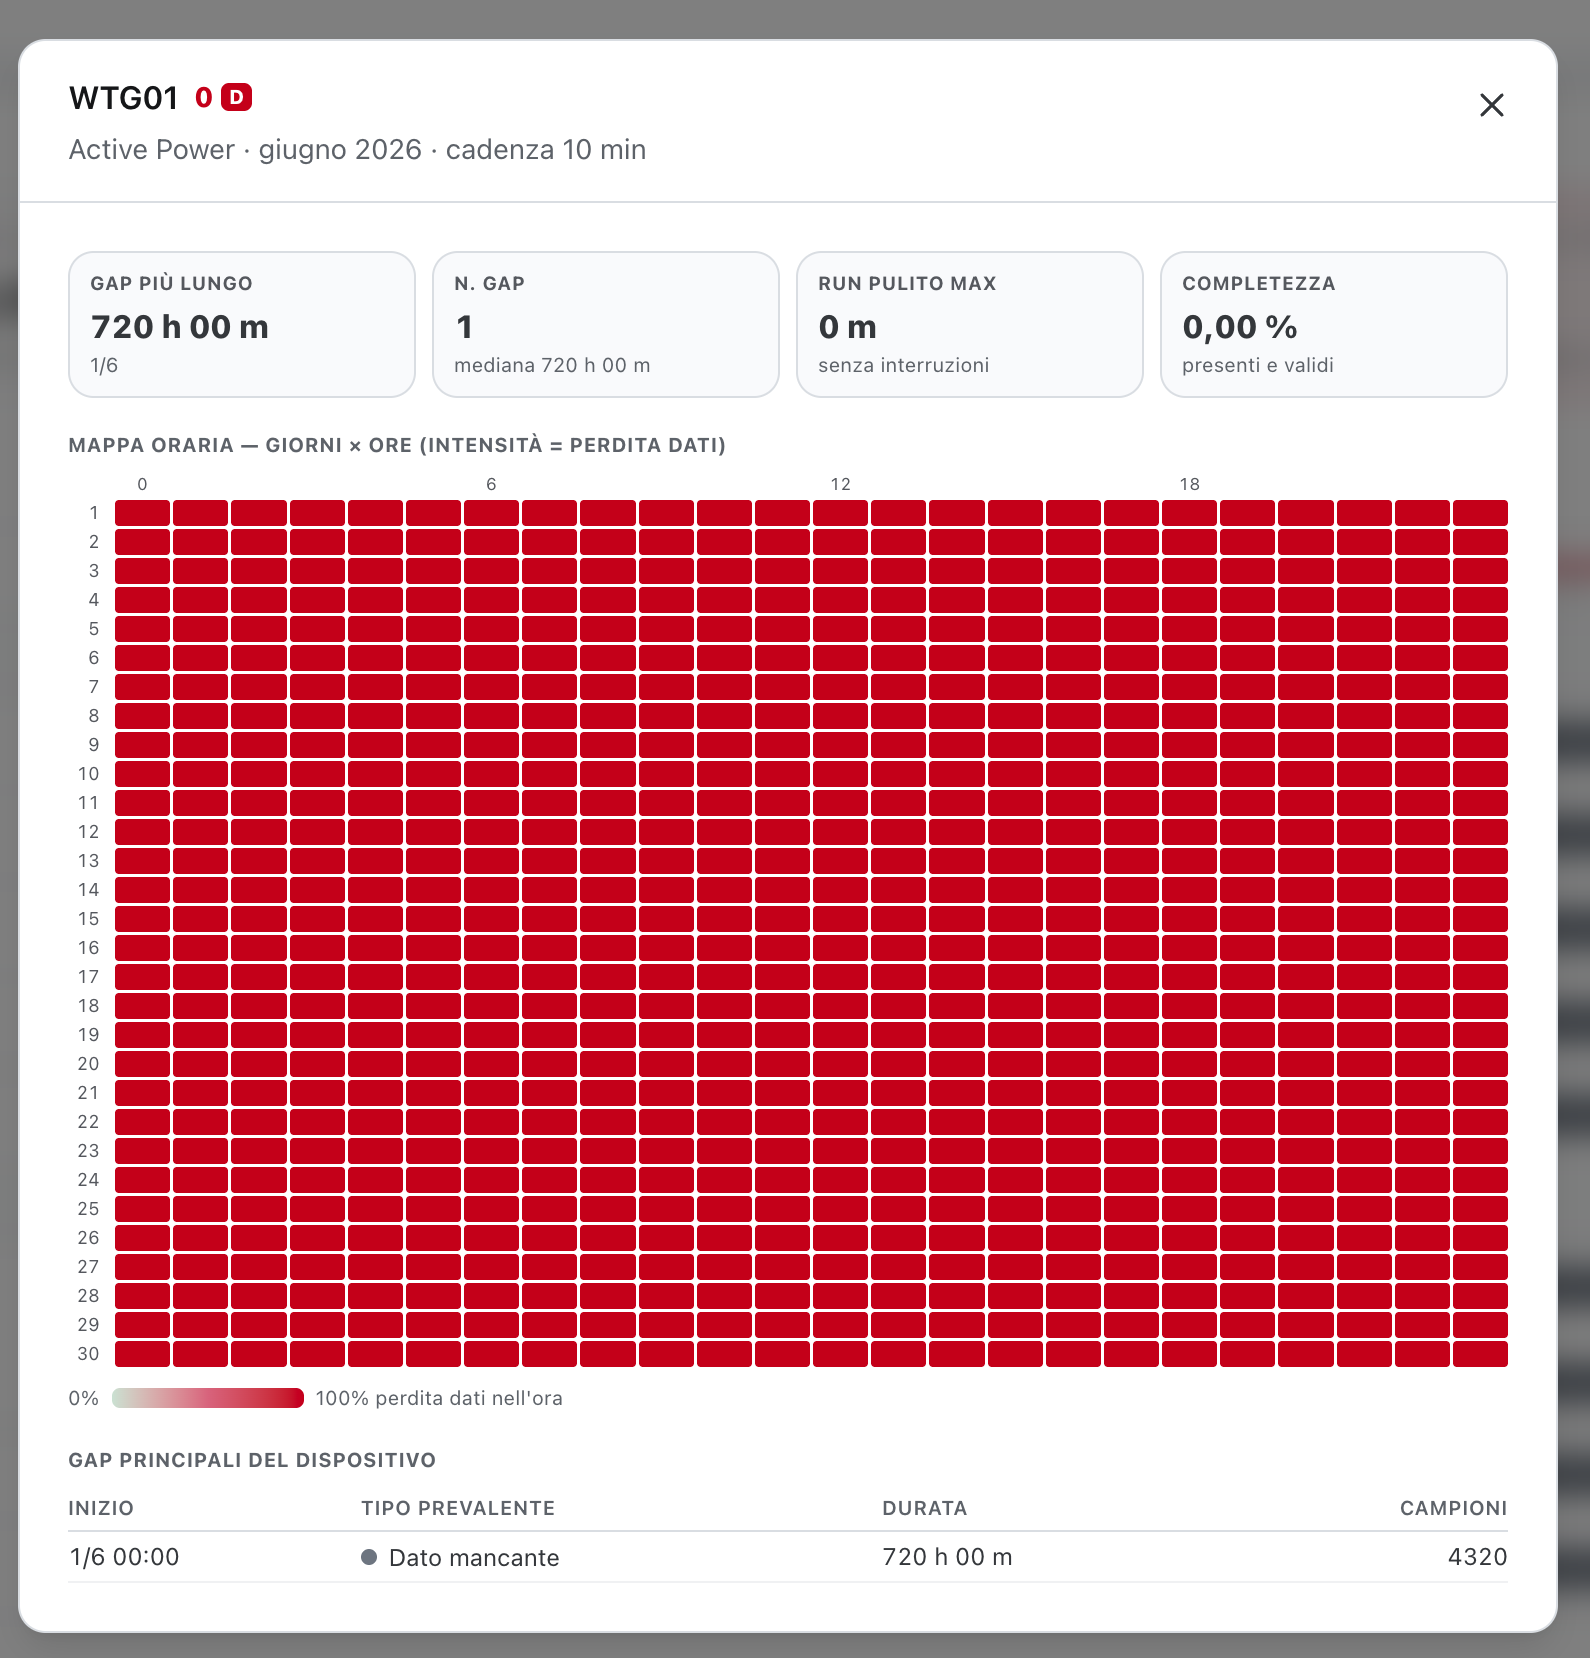
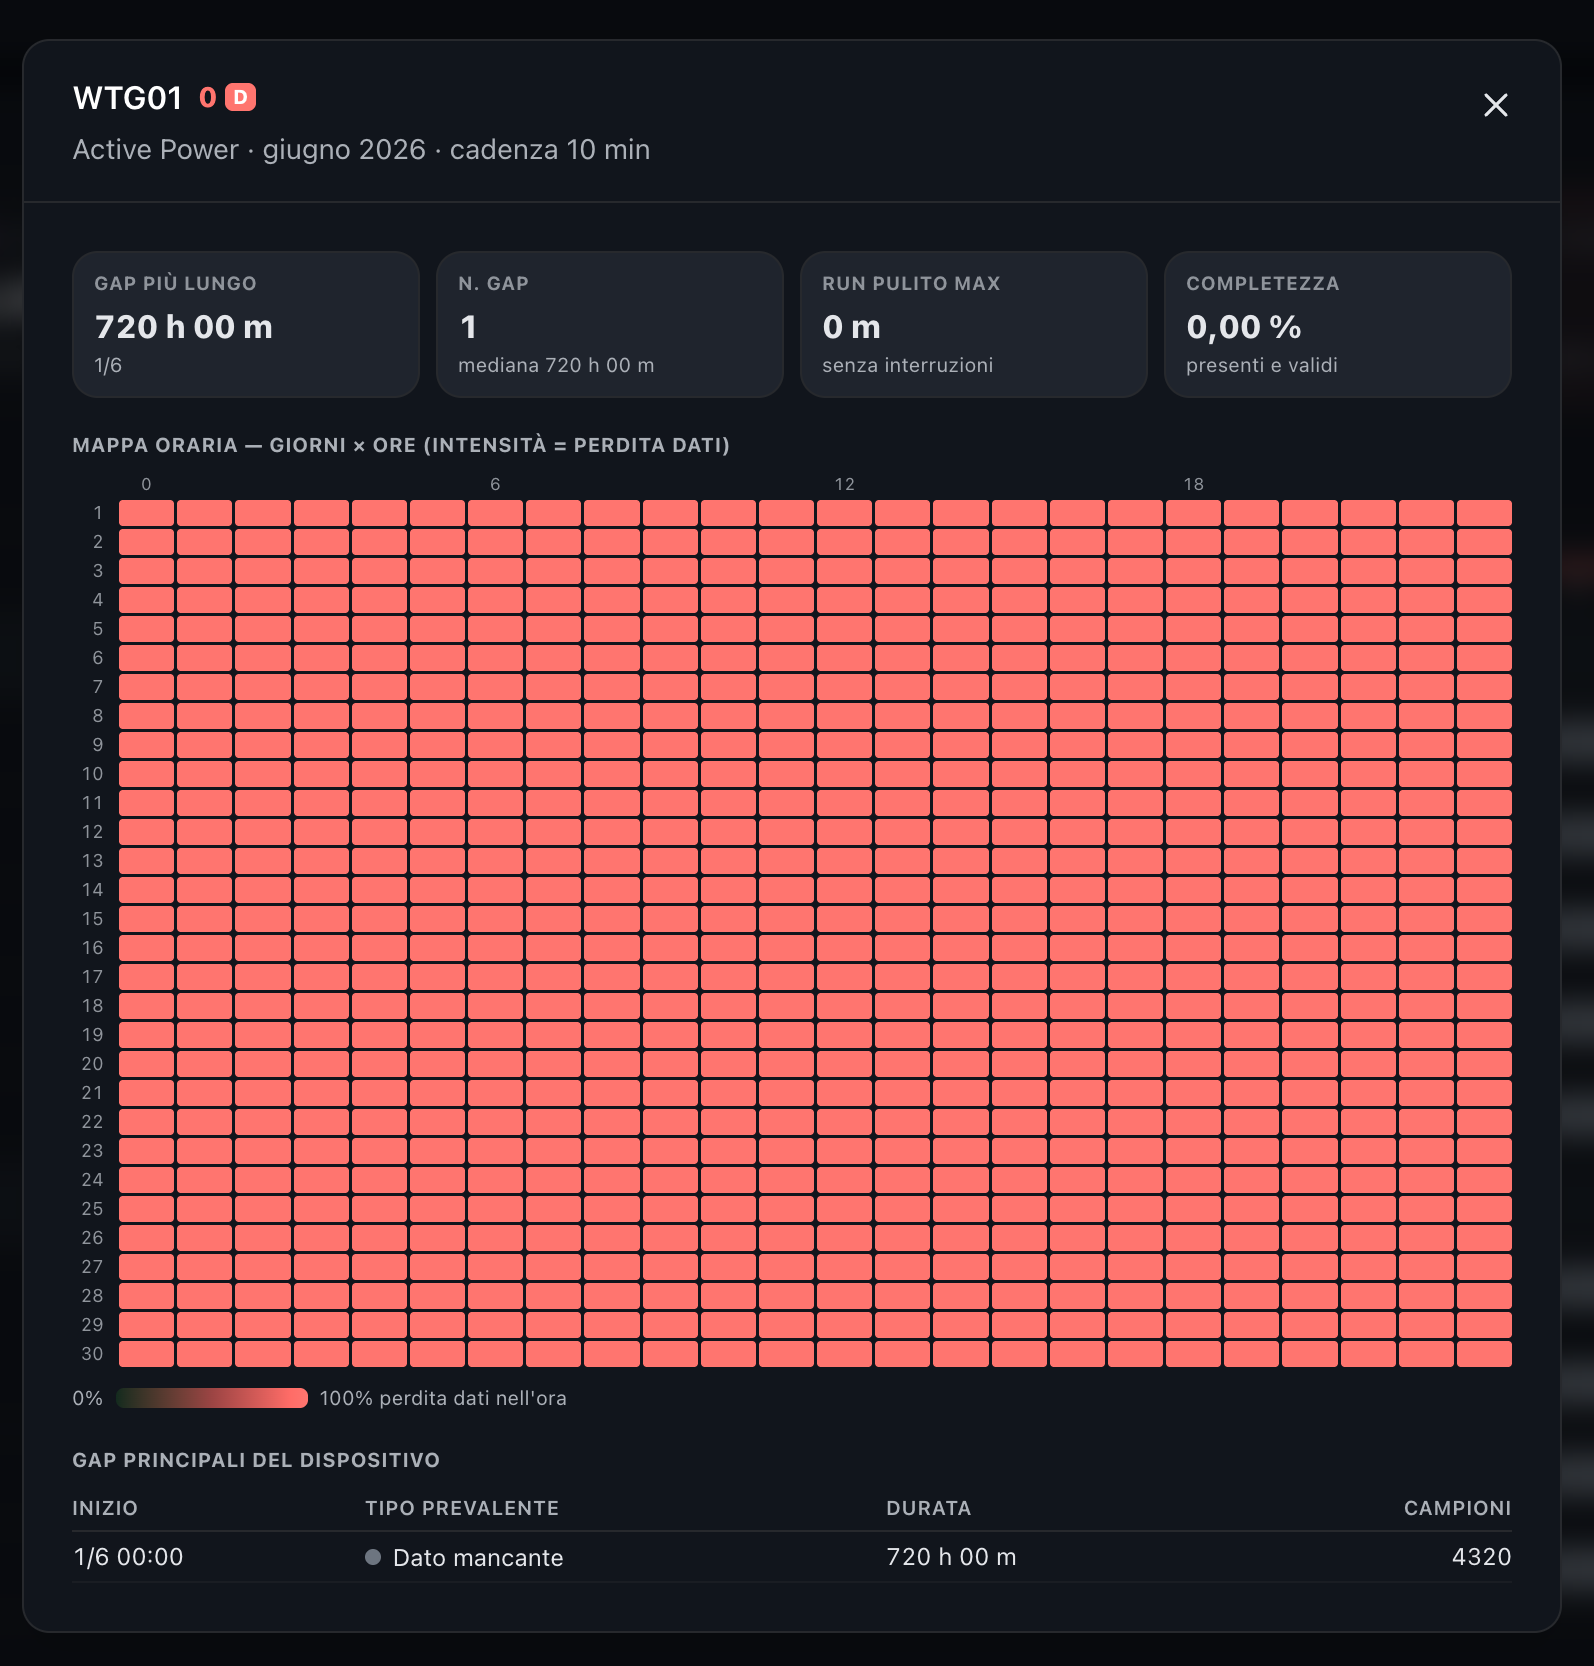
Clicking a device name opens the device detail: four stat boxes (longest gap, gap count and median, max clean run, last data / completeness), a carpet plot of days × hours where intensity is the hourly data loss, and a table of the device's main gaps.
Frequently asked questions
What is the difference between Missing and KO?
Missing (MIS) means no sample was received at all — a true gap. KO means a sample arrived but was discarded by quality control.
Why is PV completeness already "daylight only"?
For inverters and PV sensors, nighttime samples are excluded from the denominator, so completeness reflects daylight hours without a separate column.
When does the staleness badge appear?
Only for the current month, since it compares the age of the last received sample with the present time.